Aerologic diagram or Skew-t Log P Diagram
The Aerologic Diagram (AD, Skew-T Diagram) is a popular chart used by weather forecasters, pilots, paragliders, and many others. This diagram works as a template for mapping air temperature and dew points, wind.
The AD is built from aerological sounding data using a radiosonde or model data. We’re using data from the GFS27 model. The forecast depth is seven days.
Don’t hesitate to share video and feedback on how you use our Skew-T diagram!
We’re waiting for it on [email protected]
Contents of the aerological diagram:
Coordinate system
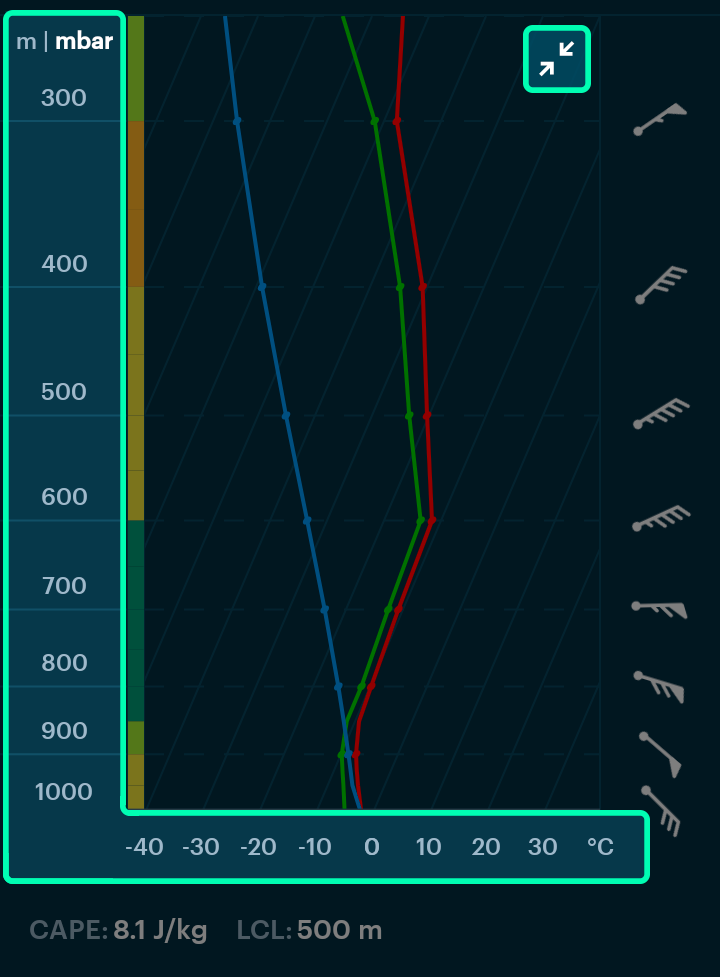
The AD has an angle coordinate system with vertical height/pressure and horizontal temperature.
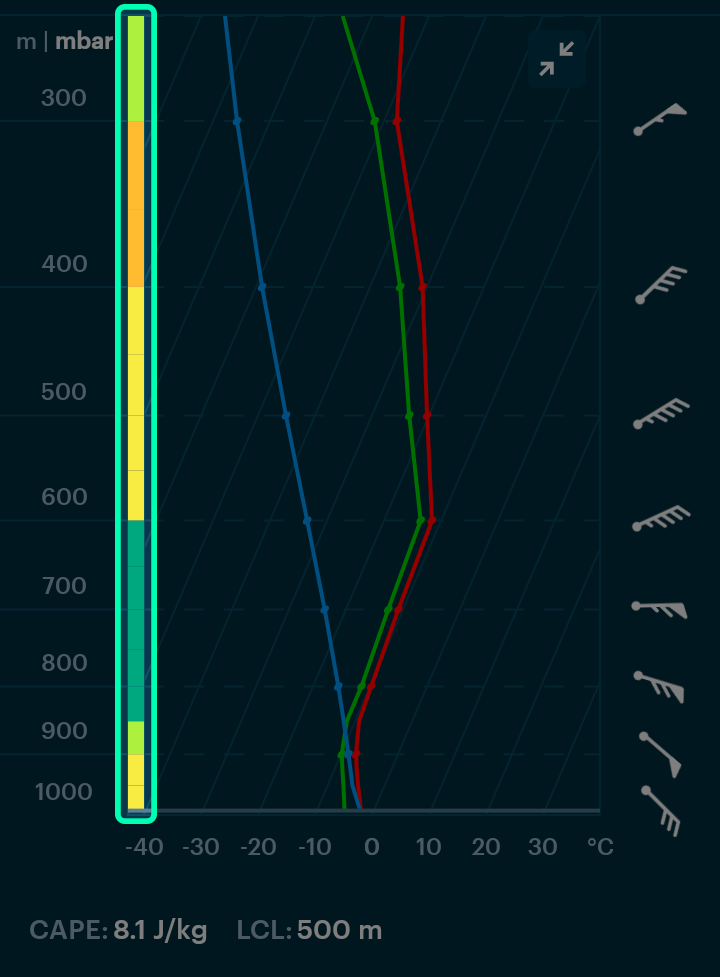
The diagram is available in two variants: up to 250 MB (approximately 10 km) and up to 600 MB (about 4 km) to allow a more detailed examination of the lower troposphere.
Temperature gradient
Temperature gradient indicates temperature change with height (degrees C /100 m).
Curves
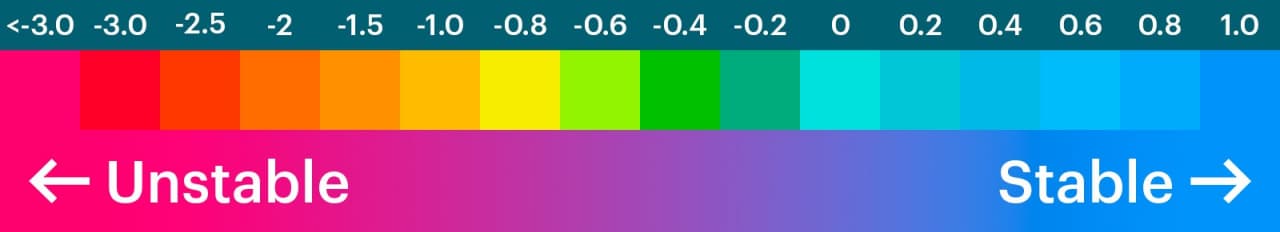
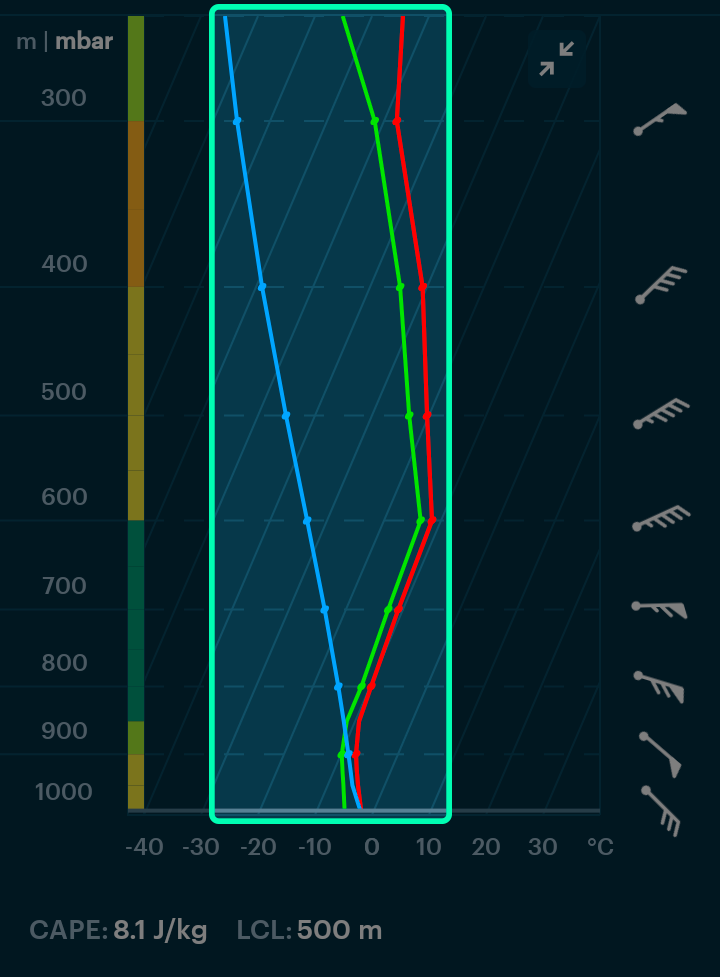
The red curve is the stratification curve. It shows the temperature of the air at different altitudes and makes it possible to assess the stability of the atmosphere, the existence of inversions, and the possibility of convection.
The green curve is the depegram or dew point curve. Shows the humidity of the air at different altitudes. The closer the depegram is to the stratification curve, the higher the humidity and the greater the probability of cloudiness and precipitation. If, on the contrary, the depegram deviates from the stratification curve by tens of degrees, then at this height it will be clear.
The blue curve is the parcel path. It is calculated from the air temperature at the surface. It shows how the volume of air that rises from the surface will behave. If the parcel path is to the right of the stratification curve, convection will develop.
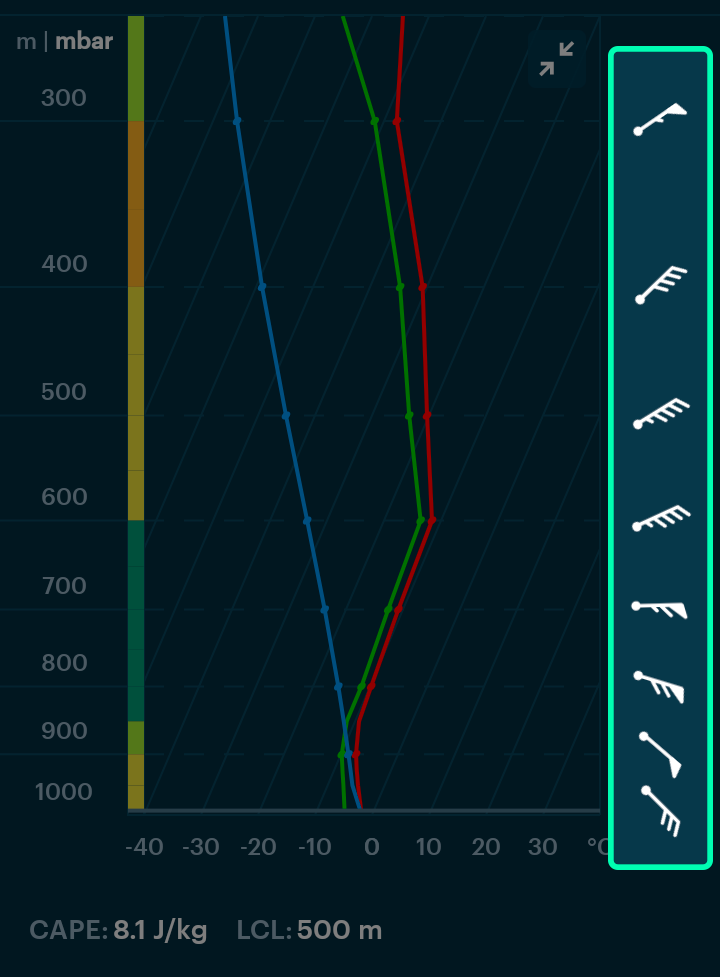
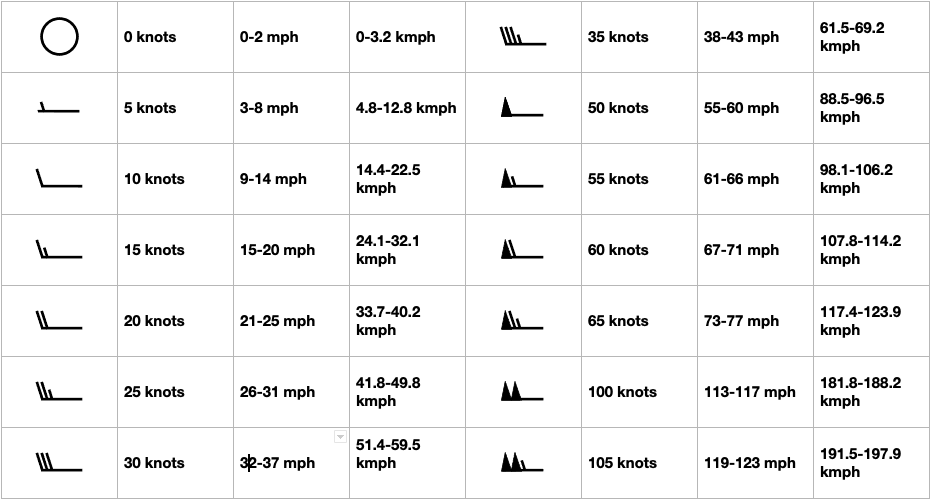
Wind barbs
The arrows with the feathers show the speed and direction of the wind. The direction of the arrow indicates where the wind is blowing from, and the size and number of feathers indicate the speed of the wind in knots.
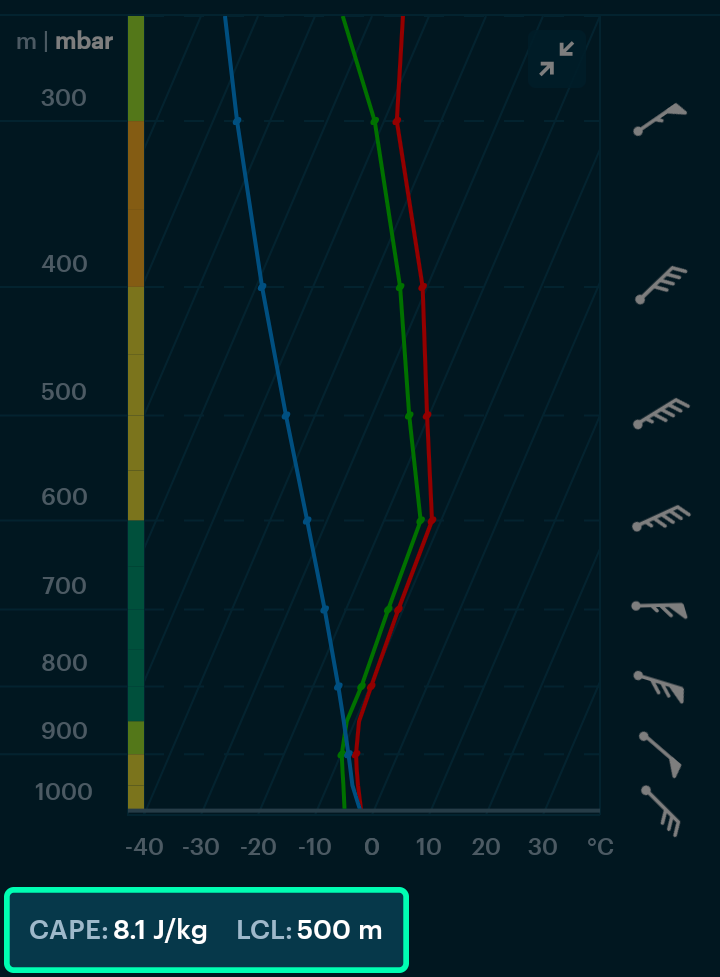
LCL and CAPE index
LCL is the level of condensation and the height of the lower boundary of cloudiness (if cloudy).
CAPE is potential convective instability energy.
CAPE below 0: Stable.
CAPE = 0 to 1000: Marginally unstable.
CAPE = 1000 to 2500: Moderately unstable.
CAPE = 2500 to 3500: Very unstable.
CAPE above 3500-4000: Extremely unstable.