How to read isobar map like an expert
Isobar map is one of the types of weather map, which in turn is one of the two most popular forms of weather forecasts, along with its presentation as a standard table. In this article, you will learn more about what isobar map is and how to read it like an expert.
What is an isobar map?
The isobar map is one of the four most common types of weather map that shows atmospheric pressure (three other maps / weather elements are air temperature, precipitation and wind).
A modern isobar map is a digital interactive (live) map you can get on some website or rather in a weather application for your smartphone and tablet.
With the development of digital technology, it is also has become possible to separate the isobar map from the other weather elements, as well as to create separate maps for many of them. Previously, on paper maps, the elements were combined on one general weather map that included wind, precipitation, temperature, cloud cover, and more.
The data you see on a typical isobar map is a forecast for today and, most often, the next 3–10 days from one of the several weather models, which, in turn, could be of one of the two main types: global with a forecast for the whole word and regional or local with a forecast for only some part of the world. For example, it could be a isobar map for North America, Mediterranean Sea cost and the like.
Accordingly, an isobar map is needed to get the appropriate forecast in a visual form that the usual forecast table, graph, and other forms of presentation do not provide. It is also a way to get a bigger weather picture.
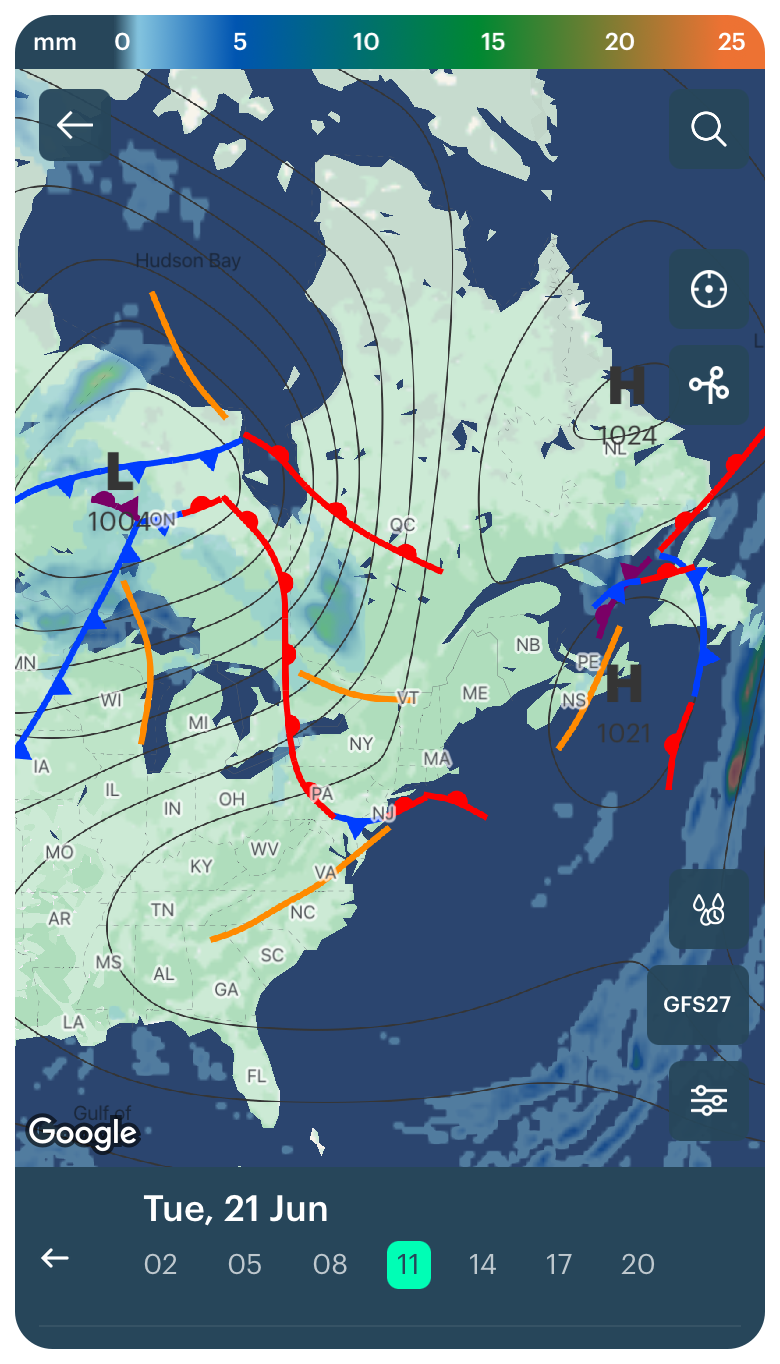
Weather fronts and isobars map in the Windy.app for iOS
How to read isobar map?
To read any type of weather map correctly, you need to know that there is no single weather map, there are many, and they look different with different information and visualization depending on the source.
However, the weather map generally consists of the following basic elements, so keep your attention on them, while reading the map:
- colors,
- special symbols,
- numbers,
- letters or phrases,
- lines,
- different interactive elements.
So, let's figure out how to read isobar map using the Windy.app as an example in 10 steps:
1. Let's start with the atmospheric pressure itself. It is the pressure of air on the Earth's surface and all objects on it, including human beings. In other words, it is the weight of the atmosphere.
2. The pressure is lower in areas with warmer air and higher in areas with colder air.
3. So one of the two main things, which isobar map shows you is areas with different atmospheric pressure. You see the big letters L and H "scattered" around the globe.
The L is an area of low atmospheric pressure or cyclone. In general, a cyclone means windy and rainy weather. H is a high atmospheric pressure zone or anticyclone. Generally, an anticyclone means sunny and windless weather.
Learn more about cyclones and anticyclones in this article.
4. The numbers on a map under the letter H and L, as well as along the lines show you the exact atmospheric pressure for different areas.
At sea level, the normal pressure is 760 millimeter of mercury (mmHg) or 29.92 inch of mercury (inHg) or 1013.25 hectopascals (hPa).
The pressure is also different at different heights, regions and weather conditions.
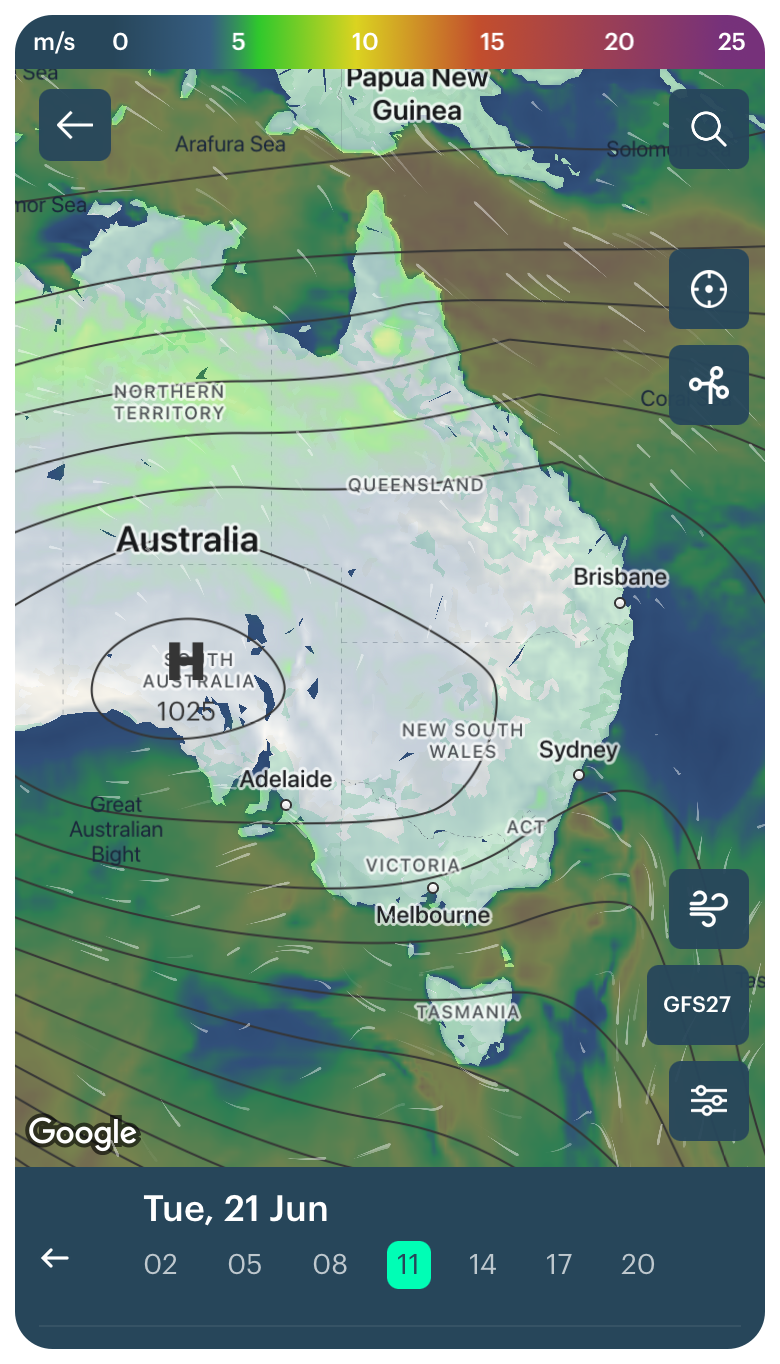
Weather fronts and isobars map in the Windy.app for iOS
5. Now let's go to the lines on a map.
Isobar map is a map with continuous lines that curve at different angles and form rings. These are isobars.
Isobars are a type of isolines, lines that are used to show areas with the same values on a flat map for different weather and other parameters — wind, temperature (for this used isotherms), and, for example, atmospheric pressure. Isobars show just that. That is, there will be the same pressure along the entire length of the line on the map.
6. Air masses always tend to move to lower pressure areas. The air also do it using the shortest way — at a right angle to the isobar. The perpendicular is called a normal line.
7. Because the pressure difference is the only thing speeding wind up, the isobar map is also very useful for understanding of not only to know the H and L pressure areas but also what kind of wind it is now and where it is blowing.
The quicker the pressure changes from spot to spot, the higher the wind speed is. All the other forces, such as friction, only reduce wind speed and/or change its direction.

Weather fronts and isobars map in the Windy.app for iOS
8. The wind would be perpendicular to the isobar if the Earth wasn't spherical and rotating around its axis. But instead, all moving objects, including wind, are subject to the influence of the so-called Coriolis force.
9. It deflects wind from the normal line to a certain angle. In the Northern Hemisphere air is rotated clockwise (to the right) and in the Southern — counterclockwise (to the left) with reference to the movement direction.
The friction between air and sea is lower, that's why it's deflected more there. The angle is usually 40–50° above land and can reach 70–80° above sea — then the wind blows practically along the isobar.
10. The higher the pressure difference between two areas is, the higher the wind speed is. That's why isobars that are close to one another mean high wind speed.
Where to get isobar map in Windy.app?
The isobar map in the Windy.app is a general weather map layer. To use it, go to the appropriate section from the Home screen or from any spot screen and activate the feature clicking on the Weather Fronts and Isobars icon in the map's settings.
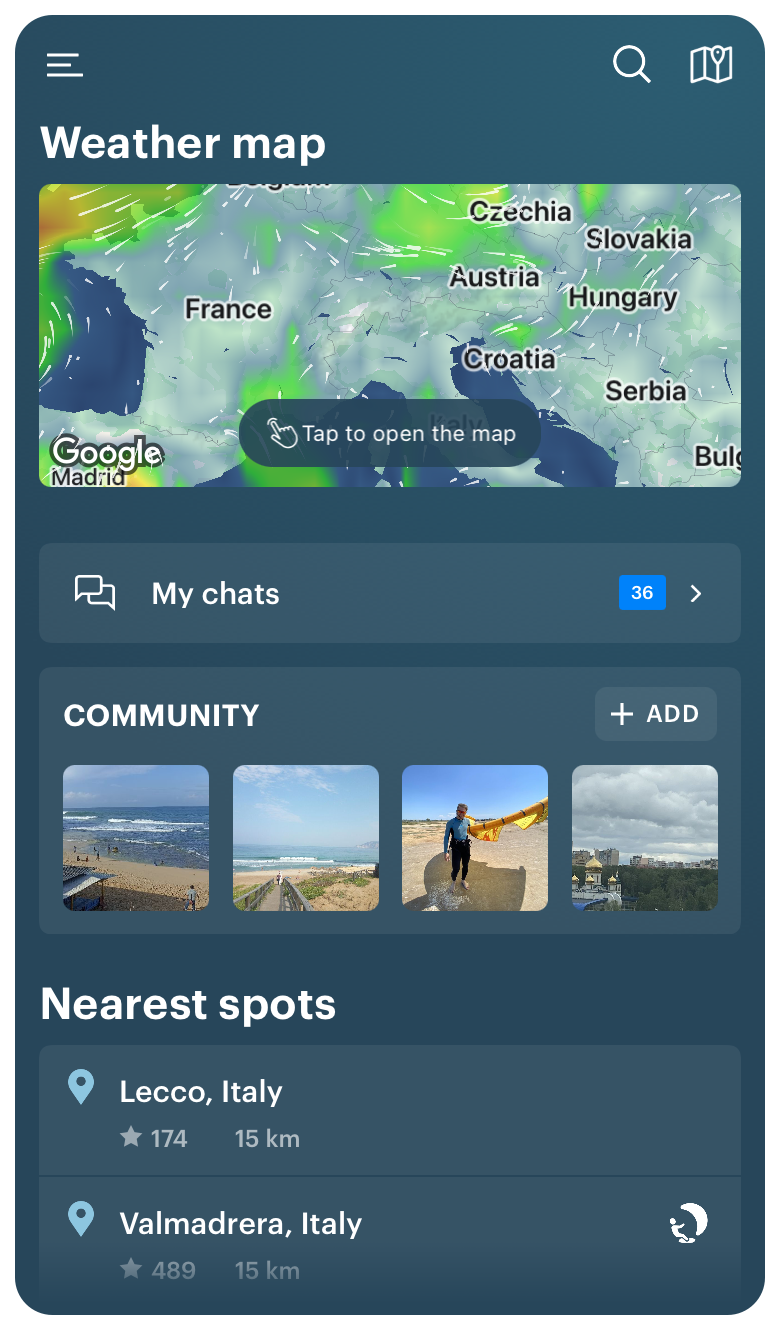
Weather map on the Home screen in the Windy.app for iOS
This is an updated and revised post, which was originally published on the Windy.app blog on November 11, 2019.
Text: Windy.app, Ivan Kuznetsov
Cover photo: Dmitry Limonov / Unsplash
You will also find useful
The basic meteorology for yachtsmen and yachtswomen
How to read a weather map like an expert
Aerological diagram — useful tool for altitude weather forecasting
Latest News
Professional Weather App
Get a detailed online 10 day weather forecast, live worldwide wind map and local weather reports from the most accurate weather models.
Compare spot conditions, ask locals in the app chat, discover meteo lessons, and share your experience in our Windy.app Community.
Be sure with Windy.app.


