
How to read isotherms shown on climate maps
Today we're going to find out what isotherms are and why we need them.
What are isotherms?
How do we show mountains on a flat map? Usually they're just lines. The result is that we see uneven rings that indicate different heights.
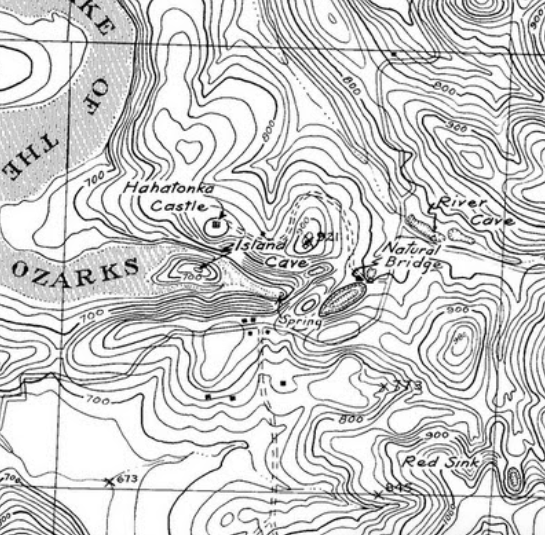
These are isolines - points with the same value through which a line is drawn.
You can use isolines to show all sorts of things: not only areas with the same height, but also areas with the same pressure or precipitation level.
1.png)
Isolines of the same temperature (as in the picture above) are called isotherms.
Meteorological stations and satellites all over the planet help collect data and draw isotherms. You get a map of average temperatures (to be precise - average annual temperatures). Such maps will be different for different seasons.
Why draw climate maps?
These maps may look monotonous, but in fact they demonstrate how complex the climate is.
Let us explain. You would think that air temperature depends only on the distance from the equator: the equator receives the most sun heat, so it's hotter there, and the further away from the equator the colder it is.
On average, the temperature from the equator to the poles does fall by 0.5 degrees Celsius for each degree of latitude.
But why in New York, located at the same latitude as hot Portugal, the climate is more like in northern countries?
Why is it warmer at the North Pole in winter than in eastern Russia?
Why is it 16 degrees colder in summer on the California coast than in the deserts to the east?
.png)
One of the hottest places on Earth, Death Valley, where temperatures can reach 57 degrees Celsius, is located less than a thousand kilometers from California's North Coast, where the average daytime maximum temperature is only 14 degrees Celsius (Crescent City)
Well, there you go. Isotherms clearly show where and how temperatures deviate. Studying these deviations draws attention to other factors on which the climate depends (and not just the distance from the equator).
Temperature anomalies
One of the main reasons for isothermal deviation is that land heats up more rapidly from the sun than water. But it also cools down faster when the sun is gone.
Why does land heat up faster than water
The main reason is different heat capacity. Water has a heat capacity almost 4 times higher than land.
The higher heat capacity, the more heat has to be transferred to the substance to make it hot.
Why is heat capacity different?
Solids have a crystal lattice in their structure, so the molecules cannot move freely. And when they get energy, they begin to oscillate more quickly near the equilibrium position. It's the speed that determines the increase in temperature of the substance. In liquids, molecules can also rotate in addition to moving forward and backward, which means they need more energy to get the same speed.
So it turns out that having received the same amount of heat, liquid molecules move slower than the molecules of a solid substance. And the lower the speed, the lower the temperature of this substance is.
So on land, heat can penetrate further to the poles than in the oceans. This happens in Australia, where it's warmer in summer than it 'should be' according to latitudes. In winter, the opposite happens - the ocean is warmer than land, as water cools down more slowly.
Another important factor is sea currents. It's relatively cold on the coast of northern California because of the cold California Current. But Europe has a mild climate because of the warm Gulf Stream.
Another factor is terrain. Isotherms often show curves around mountains: they stand in the way of air masses and do not let them move further. For example, the mountains on the coast of Norway 'protect' land from the warm influence of the Gulf Stream.
And it should be noted that it's colder in the mountains in general than at sea level, as air cools with height.
Cold air can also stall in hollows and valleys surrounded by mountains. This makes Yakutia in eastern Russia, for example, one of the coldest places in winter. Average January temperatures there reach -50 degrees Celsius, and absolute minimums reach -70. In summer Yakutia's temperatures are comparable with European ones at the same latitudes.
.png)
of the coldest places on Earth - but the lowest average temperatures
are recorded in the east of Antarctica
In fact, there are even more factors affecting the climate. This includes jet streams that we've discussed earlier.
In general, you can monitor the temperature anywhere in the world with Windy.app :)
And we also have an archive of all weather data, including air temperature, precipitation and wind speed - use the 'ARCHIVE' function.
.png)
Read more meteo lessons in Windy.app Textbook.
Text: Windy.app team
Cover photo: Unsplash
You will also find useful
How to read a weather map like an expert
How to read a surf forecast to get the best surfing experience
How to read contour lines on weather maps
What is the difference between weather, climate, and seasons. The simple explanation
Latest News
Professional Weather App
Get a detailed online 10 day weather forecast, live worldwide wind map and local weather reports from the most accurate weather models.
Compare spot conditions, ask locals in the app chat, discover meteo lessons, and share your experience in our Windy.app Community.
Be sure with Windy.app.


