
How to read contour lines on weather maps. A brief manual
In the past two posts, we learned the definition and an interesting history of invention of isolines, as well as the basic types of such lines we can see on weather and other maps.
In this one, we will learn how to read contour lines to quickly get the information you need. Generally speaking, it is very simple because the principle of reading them is the same for all types of isolines.
First, pay attention to the location of the contour lines
This is the most important thing from this manual. When lines are located close to each other, it means a big value and/or fast change of this value, and when they are far from each other, it means a smaller value and slower change.
Again, the easiest way to understand this is to look at a map of terrain: a lot of isolines close to each other on a map means that it is a high mountain with a steep slope. Conversely, lines far apart indicate a gentle slope.
The same applies to isotherms on a map with the equal temperature, isobars on a map with the equal atmospheric pressure, and so on. This is how isolines can be used to determine the weather for a given parameter. More: on a map with isobars you can also determine wind direction and strength by looking at the location of the line.
For example, in the Windy.app, on the time of publishing of this manua, north of Halifax, Nova Scotia, Canada, we see a large area of low pressure (L) and many isobar lines around it that are very close to each other:

Counter lines on the Weather Map in the Windy.app for iOS
Second, remember the types of contour lines
The types of isolines you see on a map are also important for reading different values and are designed to help you read the map faster and better. Lines can vary in type, thickness, and color, which means one thing or another depending on the map:
- Type. Usually, the lines are solid, but they can be dashed. Dotted lines are usually used to indicate the intermediate step of the isoline where it is difficult to show the value. For example, if two solid lines represent 1 and 2, then a dotted line would be 1.5 — in the middle.
- Thickness. Sometimes maps may have thinner contour lines about the main ones. Thick isolines are usually used for every fifth (by height) horizontal line on topographic maps. This is also done to specifically mark a group of isolines so that you can read the map faster.
- Color. Isolines are usually drawn in brown (or grey, or black), but their color can be different or it can change on the same map — for example, when an isoline passes over a glacier, which is marked in white, the isoline becomes blue — so it is better visible on the white color. Isobaths (lines of the equal depth of a water body) are also usually blue.

Contour lines on topographic maps. Photo: Cottonbro / Pexels
Third, find the numbers on the contour lines map
The exact values of parameters are usually indicated by figures with a certain interval: 10, 20, 30... and so on. This is also called the “map scale”. For example:
- 8,000 meters (26,246 feet) above sea level is the height of the 14 highest mountains on Earth, including Everest;
- 54.4 degrees Celsius (129.9 degrees Fahrenheit) is the highest temperature on Earth recorded at Death Valley National Park in the United States on August 17, 2020;
- 760 millimeters of mercury (29.92 inches of mercury, inHg, 1013.25 hectopascals, hPa) is the normal atmospheric pressure at sea level.
The units of measurement differ depending on the parameter and the region where it is commonly used: for wind, it is meters per second, for temperature it is Celsius, etc. — the same as in a normal weather forecast.
The location of the numbers itself also matters. Usually, on topographic maps, the top of the numbers point up the slope of the terrain and the bottom point down.
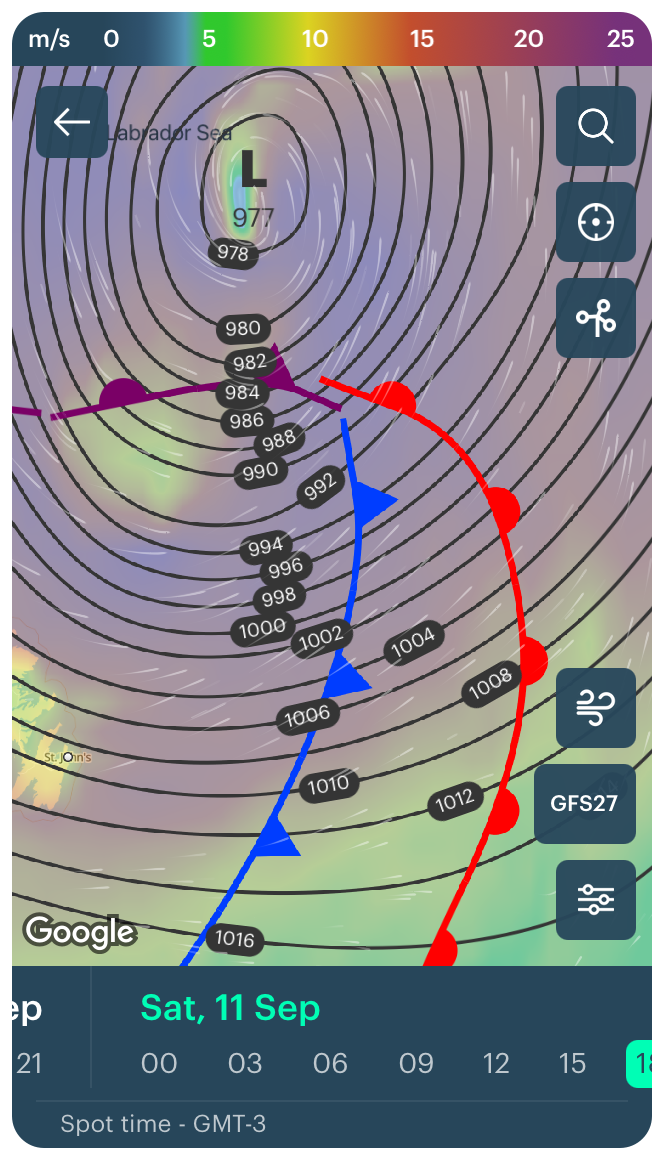
By zooming the same map in the Windy.app, we can see the exact pressure values for the same area north to Halifax outdoor spot in Nova Scotia, Canada:
Counter lines on the Weather Map in the Windy.app for iOS
This also tells you that there is a very strong wind here, as evidenced by the color of this area on the map — it is almost purple.
Look at the color scale at the top — the winds are from 20 to 25 meters per second (44.7 miles per hour). This also means a strong / severe gale on the Beaufort scale with high waves of 7–10 m (23–32 ft) at sea, crests roll over. Foam is blown along the wind direction. Large amounts of spray may reduce visibility. On land, roof tiles are blown off buildings.
Fourth, look at the specific colors of the contour lines map
To get an even better selection of isoline values on a map, the spaces between a group of lines with the same value may be indicated in a certain color. So you can see in what parts of the terrain will be higher temperature, pressure, or the slope.
On topographic maps, traditionally, different shades of green are used to color lowland terrain, brown — for mountains, white — for glaciers, and so on.
Higher temperatures, wind speeds, or accumulated precipitation are indicated by red as opposed to blue and green for lower values.
However, a map with sea depth isolines will likely be different shades of blue, where dark blue indicates the great depth and blue indicates little concerning each other.
Text: Ivan Kuznetsov, an outdoor journalist, editor and writer from the Dolomites, Italy, and Karelia, Finland, with 10 years of professional experience. His favorite sports are hiking, cycling and sauna. Read his other articles
Cover photo: Annie Spratt / Unsplash
You will also find useful
How to read a weather map like an expert. Wind, precipitation, fronts, and more
Tip: How to make biking and hiking route with weather in Windy.app
How to read a surf forecast to get the best surfing experience
Latest News
Professional Weather App
Get a detailed online 10 day weather forecast, live worldwide wind map and local weather reports from the most accurate weather models.
Compare spot conditions, ask locals in the app chat, discover meteo lessons, and share your experience in our Windy.app Community.
Be sure with Windy.app.


