
Explore different types of contour lines. Relief, atmosphere, ocean, and more
Regular readers of Windy.app’s blog already know what isotherms and isobars are. But these are just two of more than 20 main types of isolines or contour lines that will help you predict the weather.
Each isoline has a special name, which begins with the word “iso” (from the ancient Greek word “ισος” — “equal”) and further contains one or another parameter. In particular, specific names are most common precisely in meteorology.
In this post, we’ll list all the main types of contour lines and learn why we need them. We also highlighted in yellow the most important isolines that you may see on the maps most often. But let us first deal with topographic maps showing the relief, on which isolines began to be used, and only afterward — in other areas of human activity, including weather forecasting.
Earth
Relief
An isobath is a contour line connecting points of equal depths of a body of water. It can be anything — an ocean, sea, lake, or river. As human activity has always been connected to water, isobaths are the oldest types of isolines used since 1584 in Holland.
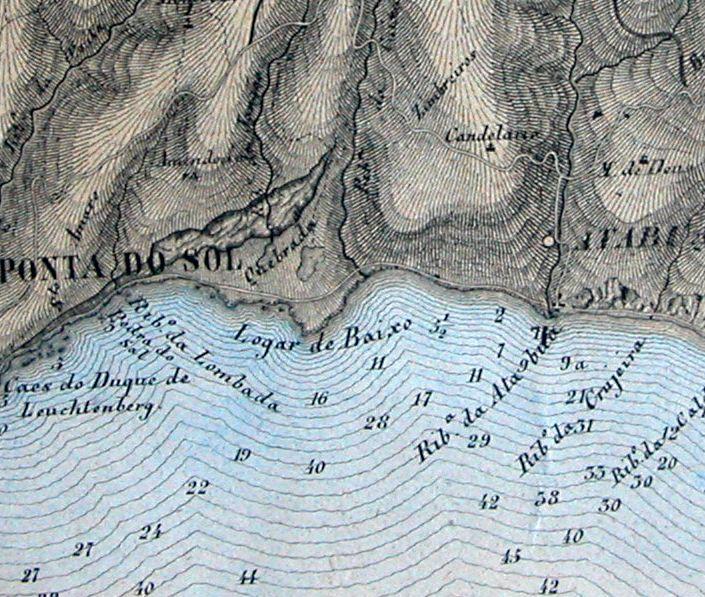
An isobaths on a fragment of a map of the coast of Madeira Island, Portugal made by António Pedro de Azevedo in 1867 / Wikipedia
An isohypse is an isoline that connects points of equal height and thus shows all the features of the terrain — mountain peaks, slopes, and hills, passes, and valleys. Historically, this is the second oldest type of contour line in the world.
A few more isolines are related to the topography:
- An isocline is an isoline that shows the equal slope of the land surface and the degree of slope smoothing.
- An isopach is a rare line of the same thickness as the bedrock. Maps with such lines are used by professional petroleum geologists, volcanologists, and other similar specialists to illustrate variations in the thickness of geologic units.
- An isobase is a contour line connecting points in the earth that rise or fall with equal velocity or amplitude. What are we talking about? This line is also used by geologists to draw maps of the neotectonic movements of the Earth’s crust.
Earth’s magnetic field
An isogon or isogonic line (which we already used to determine the same wind direction on the map), is also a contour line of constant magnetic declination — a variation of magnetic north from geographic north.
An isodynama is an isoline of the same magnetic field strengths of the Earth.
Atmosphere
Air temperature
An isotherm is an isoline that shows the equal temperature. You get a map of average temperatures (to be precise — usually, average annual temperatures). Such maps will be different for different seasons. The first map with isotherms on it was published by famous German geographer and naturalist Alexander von Humboldt in Paris, in 1817.
There are at least three additional types of isolines related to temperature:
- An isothere is a contour line of equal mean summer temperature and an isocheim — a line of equal mean winter temperature.
- An isogeotherm is the same line of the temperature beneath the Earth’s surface.
- An isodrosotherm is an isoline of the dew point temperature values — the temperature to which the air needs to be cooled so that water condensate is released from it (dew appears).
Precipitation
An isohyet is a contour line of the same precipitation: rain, snow, and others.
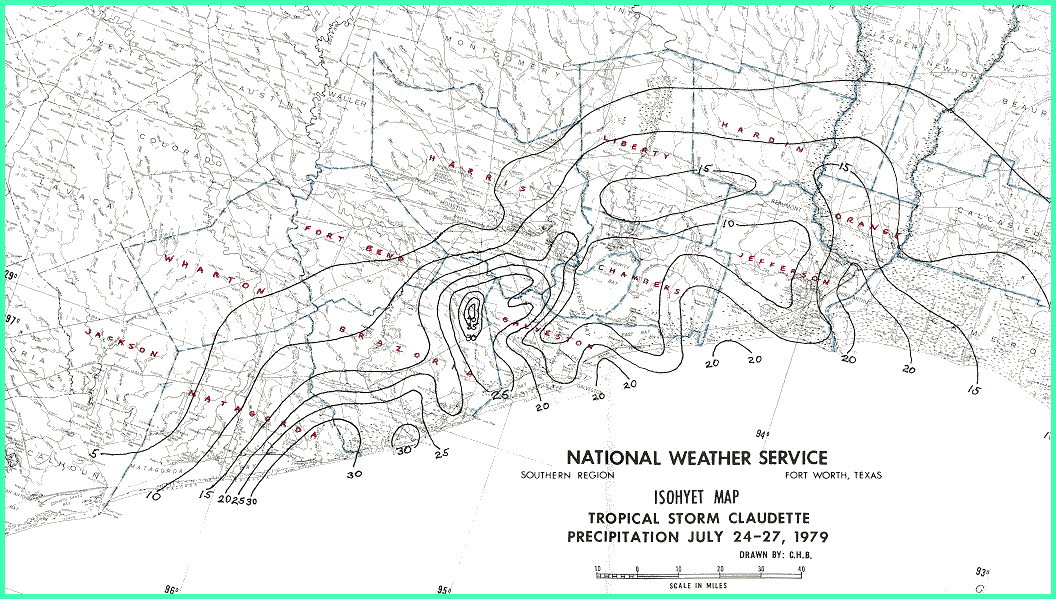
The isohyet map of the equal precipitation of the Claudette tropical storm in the area of Fort Worth, Texas, USA, in July 24–27, 1979 / NOAA
Since precipitation is one of the three main weather parameters along with air temperature and wind, this type of isoline has additional subtypes, too:
An isochalaz is a line of hail storms — lumps of ice, that can break through the roof of a car. Like other forms of precipitation, hail starts from a cloud — specifically, a cumulonimbus cloud.
An isoplat is a line representing points of equal acidity, as in acid precipitation. This type of precipitation is commonly called “acid rain” and refers to all other types of precipitation — snow, hail, fog, rain with snow (sleet), and others. The word “acidic” indicated that such precipitation is contaminated by acidic oxides of different production, cars, and so on — usually sulfur oxides and nitrogen oxides. So there is nothing good about it.
Freezing level
An isotherm at 0 °C is a contour line of the equal freezing level. The term was also invented by Alexander von Humboldt.
An isopectic (ice freezing) and an isotac (ice melting) are two other freezing level related isolines. Learn more about what is safe ice for outdoor activities in the Windy.app blog.
Wind
An isogon is an isoline connecting points with the same value of any angle and thus showing the orientation of some physical quantities. In other words, the same direction of anything. An isogon in meteorology is wind direction, and an isotach is an isoline of identical wind speeds.
There are also two other isolines related to air and wind characteristics:
- An isopycnal is a line of air density.
- An isohume is a constant relative humidity of the air — the amount of concentration of water vapor present in the air. The word “relative” means a percentage indicating the present state of absolute humidity relative to the maximum humidity given the same temperature.
Clouds
An isoneph is a contour line showing the cloud coverage of the sky — a very important weather parameter for all those involved in various aerial sports such as paragliding. It is also related to concepts such as cloud base, cloud top, and similar.
An isobront is an isoline of equal thunderstorm activity in some places. Let's recall what is thunderstorm from another lesson from the Windy.app Meteorological Textbook (WMT) for better weather forecasting: "Warm air from the warmed ground always tends upwards. It carries away moisture with it, and if the air was wet enough and the upward flows were strong enough, there are heap clouds — a factory of rain and thunderstorms".
Atmospheric pressure
An isobar is one of the main isolines in meteorology that you can see most often on weather maps. It is a line denoting an area with the same atmospheric pressure. Isobars that are close to one another also mean high wind speed. So knowing how to read isobars you can also make your own wind forecast.
Ocean
An isopycnal is an isoline that is also used to indicate the same density of water in addition to air density.
Two more related isolines here are:
- An isobathytherm is a line showing depths of water with equal temperature. You've noticed yourself when you've been swimming or scuba diving, that the deeper you go under the water, the colder it gets. And vice versa: the surface of the sea warms up the fastest from the sun.
- An isohaline indicating places with the same water salinity.
Light
An isohel is a line of equal or constant solar irradiance or the power per unit area received from the Sun in the form of electromagnetic radiation. In simple words, it represents the points receiving equal amounts of sunshine.
Other isolines about light:
- An isophote is a contour line of illuminance or the ratio of the luminous flux falling on a small surface area to its total area.
- An isochasm is a very interesting isoline of Aurora’s equal appearance. You may know this extremely bright atmospheric phenomenon better by the names Aurora Borealis, Polar Lights, or Northern Lights. This is a natural green, purple and red light display in the sky, most often seen in high-latitude regions behind the Polar Circle.
- An isodose is a line representing points of equal intensity of ionizing radiation per unit mass. It is used for mapping in order to protect against excessive radiation that is harmful to humans and other creatures, or conversely, to use its excess for good.
Human
Ecology
An isophene is a line describing the same values for a whole set of complex phenomena, in this case — biological events.
Pollution
An isobel is a contour line of environmental noise or equal sound pressure level. In addition, there could be maps with isolines for other types of pollution — of the air, soil, and others. For example, contour lines are used for smart planting to reduce the level of soil erosion.
Traveling
There are many other types of isolines that are used not only in meteorology and biology but also in other kinds of sciences, such as economics, to describe equal amounts of production and so on.
An isochrone, or time and distance isoline is one of the most interesting types of contour line related to humans. It is a line representing points of equal time-distance from a point, such as the transportation time from a particular point. One of the best known of these maps — we purposely left it for the final part of the article as the most illustrative — shows how long it used to take to get from London to different parts of the world in the 19th century:

The map of travel time from London to the different parts of the world in the 19th century made by Francis Galton and published in 1881 / Wikipedia
For example, it took at least 5 days to reach Portugal and Southern Europe by land and water, 10 days to reach Siberia in Russia, and 40 days to reach Australia and South America.
It is interestingly that the same maximum number of days was needed to visit regions in Central Africa and South East Asia, although they are closer to Europe than Australia and America. This is because the map takes into account not only and not so much the distance, but the transport accessibility of certain regions of the Earth.
In other words, looking at the map today, we can imagine how the speed of travel has changed. A lot.
Learn the definition and the history of the invention of isolines, as well as how to read contour lines on weather and other maps in the part 1 and part 3 of this big acticle.
Publish your post in the Windy.app blog and become an expert in our community.
Text: Ivan Kuznetsov, an outdoor journalist, editor and writer from the Dolomites, Italy, and Karelia, Finland, with 10 years of professional experience. His favorite sports are hiking, cycling and sauna. Read his other articles
Cover photo: Cottonbro / Pexels
You will also find useful
What is the Karman line? It defines the edge of space
What is cloud base and how else do we measure clouds
How to read Wind Chill Chart to stay comfortable outdoors
Latest News
Professional Weather App
Get a detailed online 10 day weather forecast, live worldwide wind map and local weather reports from the most accurate weather models.
Compare spot conditions, ask locals in the app chat, discover meteo lessons, and share your experience in our Windy.app Community.
Be sure with Windy.app.


