
What is freezing level chart in your weather forecast? Yes, it is about snow but not only
With the beginning of summer in the Northern Hemisphere, we almost forget about winter snow sports, and perhaps the fact that the snow has not yet melted everywhere.
However, while it may rain on a plain somewhere in Venice, Italy, the mountain peaks in the Dolomites just 100 km (62 mi) of the sea coast, are still covered with snow. The explanation for this is the freezing level. It is measured with the same instruments as the other weather parameters: weather stations, radars, probes, satellites, and so on.
In this article, we will figure out what it is and how to read the freezing level chart for your favorite summer or winter sport and outdoor activity.
What is freezing level?
The freezing level is the elevation at which the air temperature is 0 degrees Celsius, 32 degrees Fahrenheit, or 273 degrees Kelvin. At this temperature, water freezes, including particles of moisture in the air*.
Below the freezing level, the air temperature is positive (+) and the moisture does not freeze; above the freezing level, the air temperature is negative (–), and the moisture freezes. The higher the freezing level, the colder the air and the faster and stronger the moisture freezes. In other words, this is the line that separates snow and rain, or where the snow stops melting. This also explains why there is snow on the top of the mountains.
The freezing level is not the same in different places. In general, it descends in cold and humid areas and rises in dry and warm areas. That is, the farther from the equator, the lower the line.
It is also not the same for different seasons. For example, in winter, in mid-latitudes, the freezing level is equal to the surface of the earth or may even be below it. In summer, on the contrary, the figure is as high as possible. Again, this is because the atmosphere is colder in winter and warmer in summer.
Photo: Dino-reichmuth / Unsplash
In addition, the freezing level may change in one place and in one relatively short time interval. These changes are caused by changes in different weather parameters.
For example, freezing level may be affected by air density (which can vary due to warm and cold weather fronts), humidity levels, winds, and other things. Therefore, the forecast of the freezing level can be considered as accurate as possible for a period of one to three days — just like with a regular weather forecast.
This weather parameter is not usually available in general weather forecasts, but it can be found in special forecasts where this parameter is important — for example, in the mountains, and for aviation needs.
Speaking of mountains and aviation. The concept of the freezing level should not be confused with the concepts of the snow level (usually in the mountains when skiing) and icing level (this parameter is important for aviation). These are related but still slightly different things.
We will talk about this in other articles, so bookmark this one to come back to it in winter and learn more.
How to read freezing level chart?
The freezing level is usually presented as a chart or a graph. This is most convenient for the user of the weather forecast, who is used to checking it in the weather app on his phone. So the freezing level chart and its presentation may be different depending on the source of the weather forecast, there is no single system.
Let's take Windy.app as an example, where the freezing level for the popular ski spot Passo Tonale in Italy looks like this:

Freezing level chart in the Windy.app for iOS / Windy.app
The blue line on the chart labeled Freezing level with the numbers to its left shows exactly at what altitude the temperature is 0 degrees. Above the freezing level, it snows, and below it, it rains. Again, that's the difference.
You also see the forecast for snow and precipitation at the same time: one and two drops of water or snow mean less and more rain and snow, respectively.
The chart also shows that the freezing level changes when you move the forecast into the future or select specific hours and dates. In the app, you see the freezing level forecast for the different periods depending on the location of the spot and the weather forecast for 3 days to 10 days depending on the weather model. Learn more about these and other weather forecast durations.
Finally, in addition to the freezing level, here you have two other lines of the altitude for the lowest and the highest point of the resort, where the elevator can take you. For example, for the same Tonale Pass in Italy, it is 1100 m (3,608 ft) and 3000 m (9,842 ft), respectively. From the latter height, you can go down on skis.
There are no these ski lines in the freezing level chart for some city, but you can still see the altitude for that spot represented by the orange line — like for the city of Bergamo in Italy (289 m):
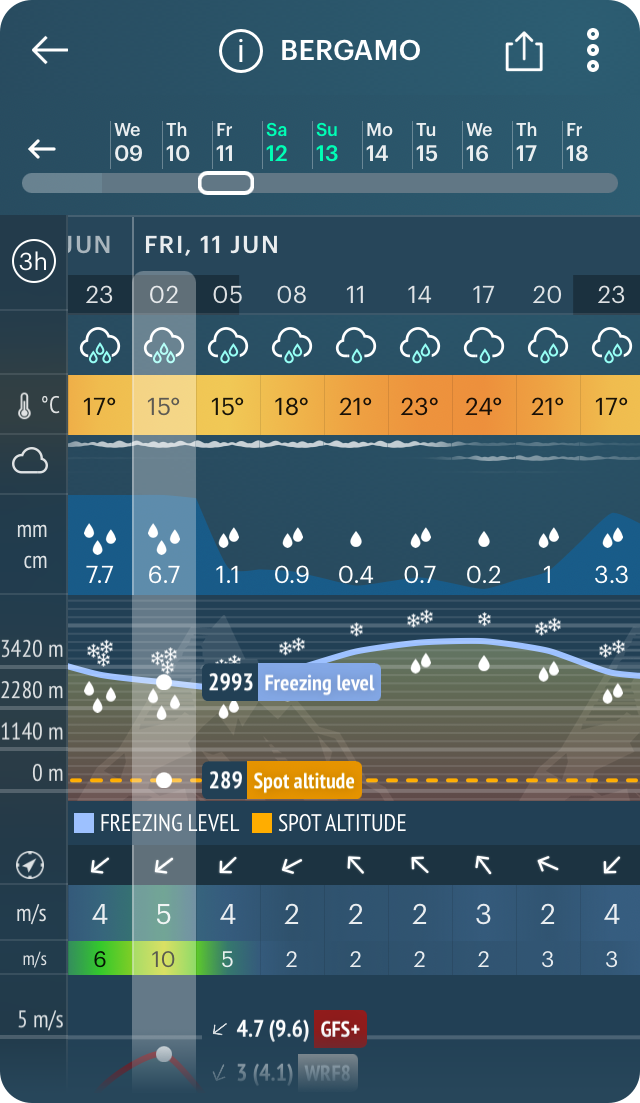
Freezing level chart in Bergamo, Italy in the Windy.app for iOS / Windy.app
What is considered a low freezing level?
For example, in the southernmost city in the world, Ushuaia, in Argentina, at the tip of the South American continent, where it is winter now, the freezing level is quite low at 460 m (1,509 ft) above sea level. The spot is also at sea level:

Freezing level chart in Ushuaia, Argentina in the Windy.app for iOS / Windy.app
But there are more interesting things here that you can find in Windy.app: in the city of Svalbard on the Norwegian Svalbard Islands, the freezing level is even lower than the ground level by 3 m (9.8 ft), 26 and 29 m (85 and 95 ft), respectively:
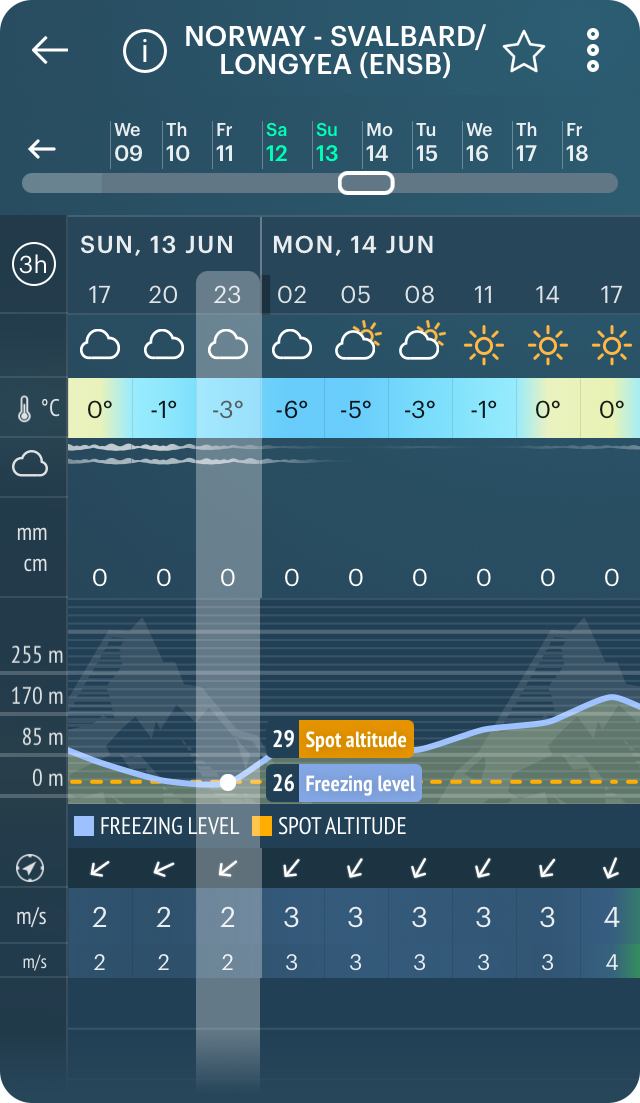
Freezing level chart in Svalbard, Norway in the Windy.app for iOS / Windy.app
Now let's look at the high freezing level. At the same time, on the Skydive Dubai Desert spot, in the UAE, the freezing level is very high, reaching an altitude of 6,319 m (20,731 ft). The spot itself is only 174 m (570.8 ft) above sea level:
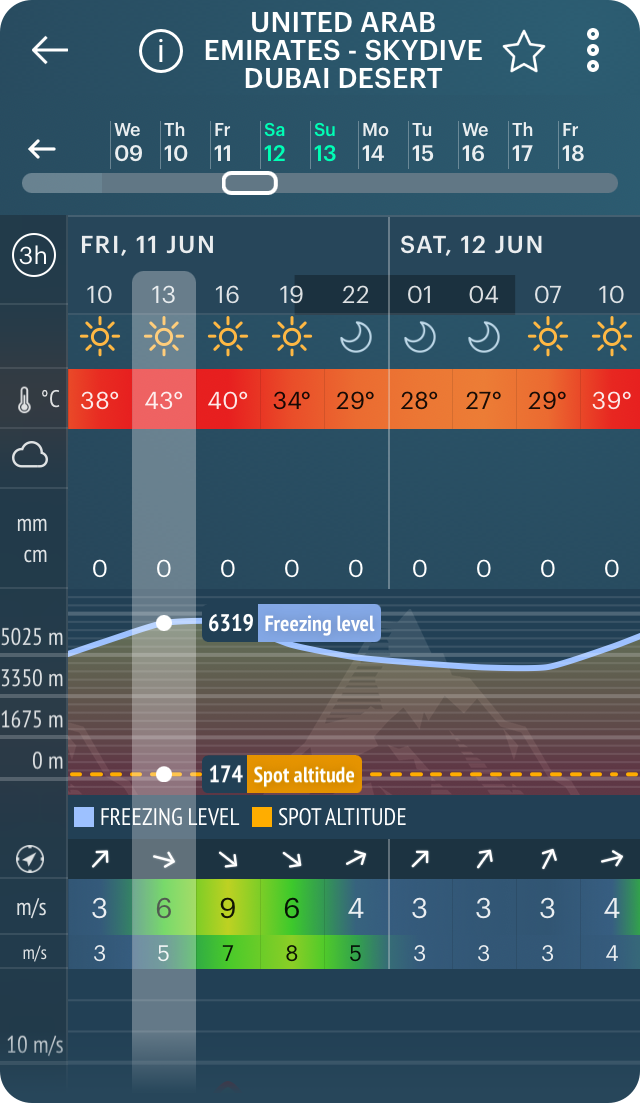
Freezing level chart in Skydive Dubai Desert spot, UAE in the Windy.app for iOS / Windy.app
Last remark here: freezing levels may also be available in the form of a weather map for a region or a country. For example, that's how it looks in the National Oceanic and Atmospheric Administration (NOAA) forecasts for the USA.
Where to find freezing level in Windy.app?
In Windy.app, the freezing level is available in the special Snow Weather Profile with a pre-set of 10+ weather parameters needed for all snow sports: alpine and cross-country skiing, snowboarding, snowshoeing and others. To open the profile:
1. Select your favorite spot or the nearest spot (enable the geolocation feature in the app to do this) from the Home screen, or select your city in the app to see the freezing level for it.

Windy.app for iOS Home screen / Windy.app
2. Select a profile via the icon to the right of the weather models. In Windy.app the prediction of the freezing level is by the global ICON13 weather model.
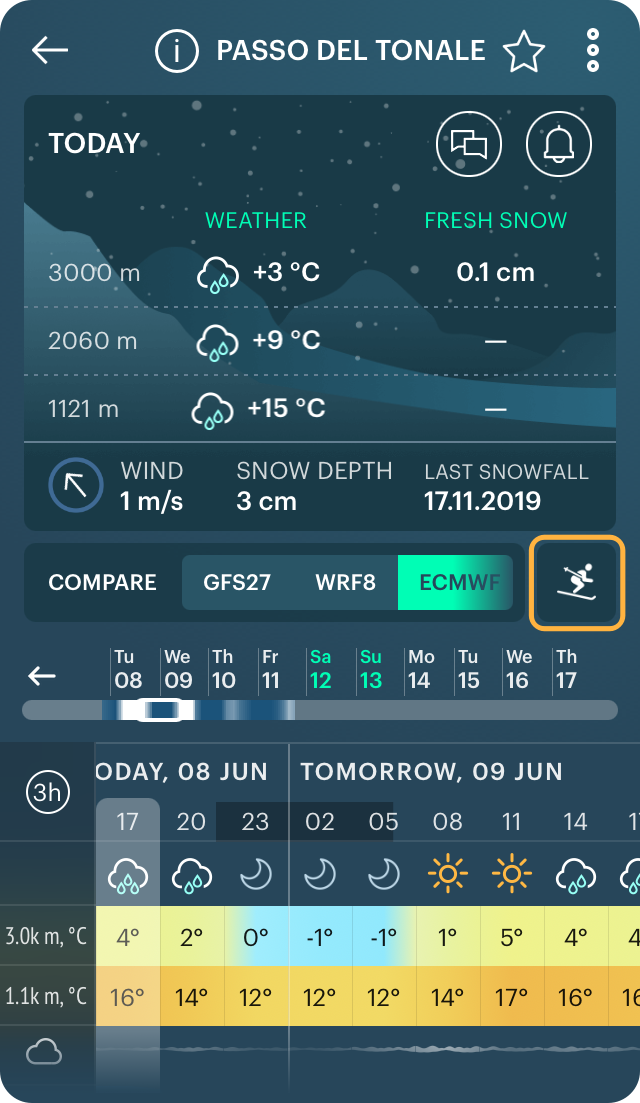
Passo Tonale ski spot screen in the Windy.app for iOS / Windy.app

Snow Weather Profile in the Windy.app for iOS / Windy.app
3. Find the freezing level chart in the weather parameters table and get the most accurate forecast.
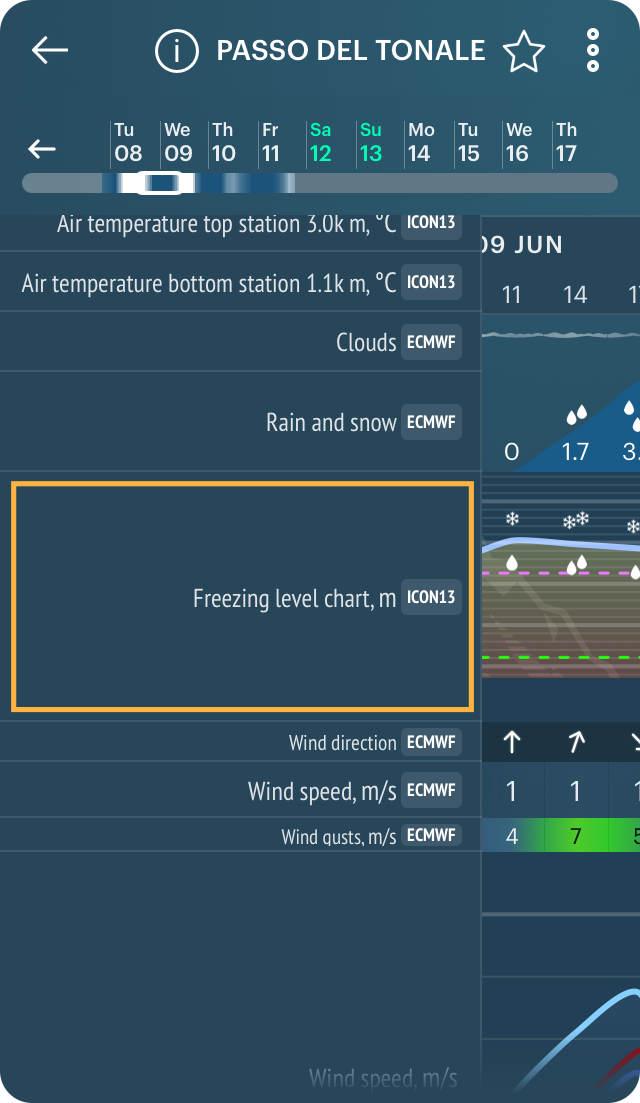
Freezing level chart in the weather parameter in the Windy.app for iOS / Windy.app
* Although the nominal freezing point of water is 0 °C, water in the atmosphere does not always freeze at this temperature and often exists as a "supercooled" liquid.
Text: Ivan Kuznetsov, an outdoor writer from the Dolomites, Italy, and Karelia, Finland. His favorite sports are cycling, hiking, and sauna. Read his other articles.
Cover photo: Sacre-bleu / Unsplash
You will also find useful
Mini guide to snow sports with Windy.app
Latest News
Professional Weather App
Get a detailed online 10 day weather forecast, live worldwide wind map and local weather reports from the most accurate weather models.
Compare spot conditions, ask locals in the app chat, discover meteo lessons, and share your experience in our Windy.app Community.
Be sure with Windy.app.


