
Learn to read Planetary K-Index — get the geomagnetic storms forecast
The Planetary K-Index is the main index used to measure the power of geomagnetic storms. In this article, we will figure out what K-Index is and how to read it correctly in order to try to avoid the negative effects of geomagnetic storms.
What is the Planetary K-Index?
The Planetary K-Index is a type of the K-Index, the most common of the ten different indices used by meteorologists to measure the power of geomagnetic storms on Earth. In other words, the K-Index is the deviation of the Earth's magnetic field from its normal state.
A necessary side-step: Geomagnetic storms are just like normal storms. Well, almost. They differ from ordinary ones in that they occur in the Earth's magnetic field and are related to space weather.
The storms are caused by streams of solar wind that enter the magnetosphere — the region of the magnetic field around the Earth (and other celestial bodies).
These storms last from a few hours to a few days and adversely affect spacecraft operations, satellite navigation, power systems, high-frequency (HF) radio communications, and even the individual electronic devices, and the like.
For example, the Elon Musk's aerospace company SpaceX lost about 40 satellites of Starlink system, distributing the Internet from space, of the 49 launched into orbit on February 3, 2022, due to a powerful geomagnetic storm. The company announced this on its official website, disclosing the reasons: "An increased atmospheric resistance of 50% at low altitudes prevented the satellites from leaving safe mode to begin orbital raising maneuvers. The satellites re-entered Earth's atmosphere and destroyed."
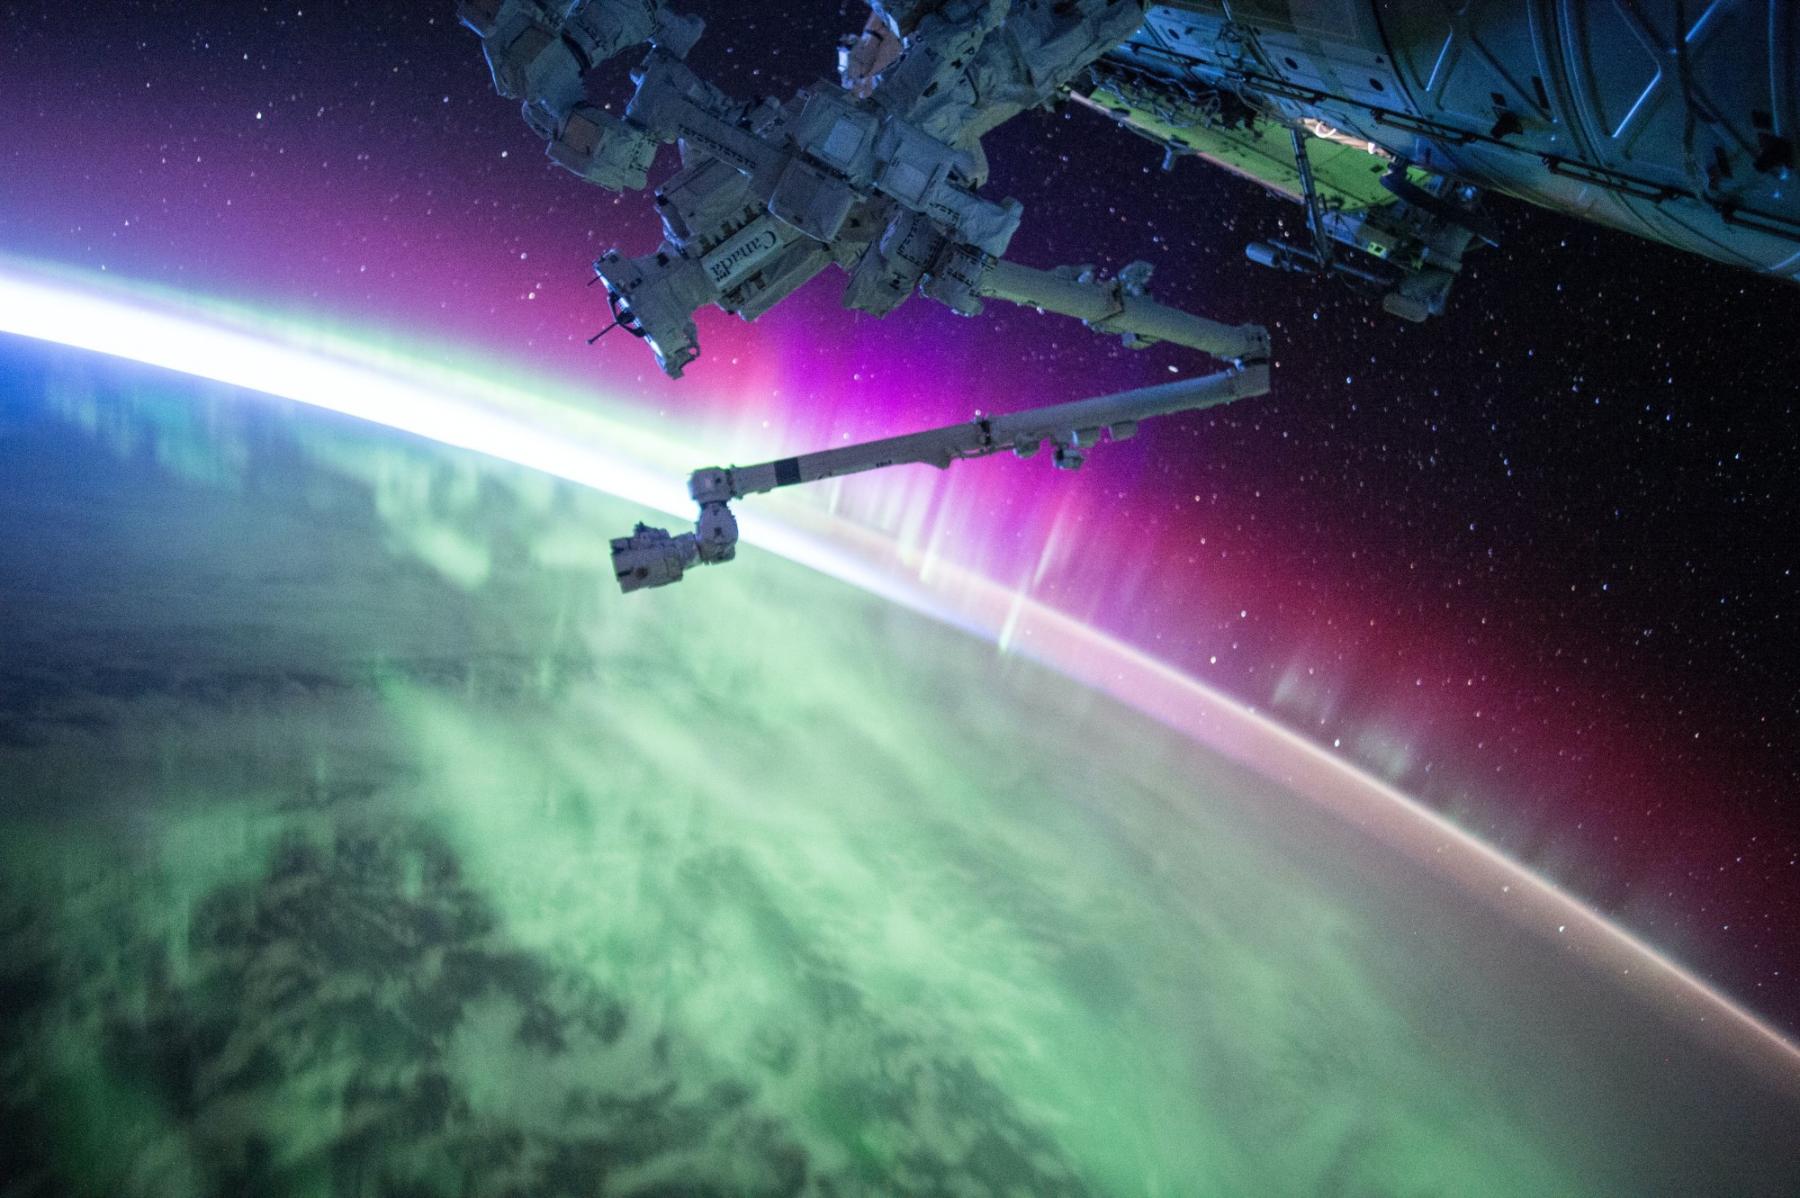
Geomagnetic storms also cause Aurora or Northern Lights — the glow of the Earth's magnetosphere, due to their interaction with charged particles of the solar wind, which occurs in the northern latitudes of the planet, which is important for observers of this weather phenomenon and stars.
It is thought in the scientific community that geomagnetic storms do not have any direct effect on humans, but they can disrupt the migration routes of animals.
NASA / Unsplash
Now let's continue with K-Index... The idea to measure geomagnetic storms first came to Julius Bartels, a German geophysicist and statistician, who is known for his great contributions to solar and lunar physics, geomagnetism, and meteorology. He introduced the index in 1939 (other sources say 1932, 1938, or 1949). It has since been used around the world in weather forecasts.
The index measurements are made by the magnetometer. It is a special device for measuring the magnetic field of the Earth as well as the magnetic features of various materials. Therefore, magnetometers are used not only in meteorology but also in geology, navigation at sea, biology, seismology, and other fields of science.
A few more necessary details: Why K-Index and why Planetary?
The letter K comes from the German word "kennziffer", which means "characteristic digit", which speaks of the country of origin of the index.
The Planetary K-Index, also often called Kp-Index ("p" for "planet"), is the average K-Index for the whole world. It is measured throughout the Earth at 12 geomagnetic observatories that are located between 44° and 60° north or south geomagnetic latitude. Here is their exact list and location map of these observatories:
- Germany: Niemegk, Wingst
- Sweden: Uppsala
- United States of America: Fredericksburg, Sitka
- Canada: Meanook, Ottawa
- United Kingdom: Eskdalemuir, Hartland, Lerwick
- Australia: Canberra
- New Zealand: Eyrewell
There is also an Estimated Kp-Index, which is calculated in near–real-time using 8 of the 12 observatories.
For those interested in learning more about the index, here's the official Kp-Index page on the site of the German Research Centre for Geosciences (GFZ) in Potsdam, Germany.
In addition to the K-Index, there are also at least nine other similar indices: aa, am, Dst, and others, which differ in calculation formulas and other things. All ten indices are included in the International Service of Geomagnetic Indices (ISGI) under the guidance of the International Association of Geomagnetism and Aeronomy (IAGA).

Map of geomagnetic observatories / International Service of Geomagnetic Indices
How to read Planetary K-Index?
The Planetary K-Index is counted in intervals of three hours: for example, from 0 o'clock to 3 a.m., from 3 a.m. to 6 a.m., from 9 a.m. to 12 noon, and so on. That is, the index is similar to ordinary weather forecasts, which are made for a certain limited time in the future — in general, up to 10 days.
Reading the Kp-Index is easy: it is a scale of 10 values from 0 to 9, where each digit means the strength of geomagnetic storms. Disturbances of 5 and more are considered to be storms, while values less than five indicate insignificant geomagnetic disturbance or its complete absence.
So knowing the value of the index, you can find out the strength of a magnetic storm.
However, it is not clear from the official scale what specific impact this or that storm has. Therefore Space Weather Prediction Center (SWPC) of the US National Oceanic and Atmospheric Administration (NOAA) — the leading meteorological service of the United States, has developed its own scale of geomagnetic storms named Geomagnetic Storms Scale or G-Scale, which can be considered an alternative to the K-Index and is applied on the territory of the USA.
The NOAA G-Scale also has numbered levels similar to the K-Index as well as other scales for knowing the power of hurricanes, tornadoes, and earthquakes and other extreme weather phenomena as well as normal weather (Ultraviolet Index, Heat Index, and Wind Chill factor, wind speed and power conditions and others).
Data from the G-Scale is usually presented by NOAA in the form of a graph with a forecast for three days on a special page dedicated to K-Index, which is updated every minute:
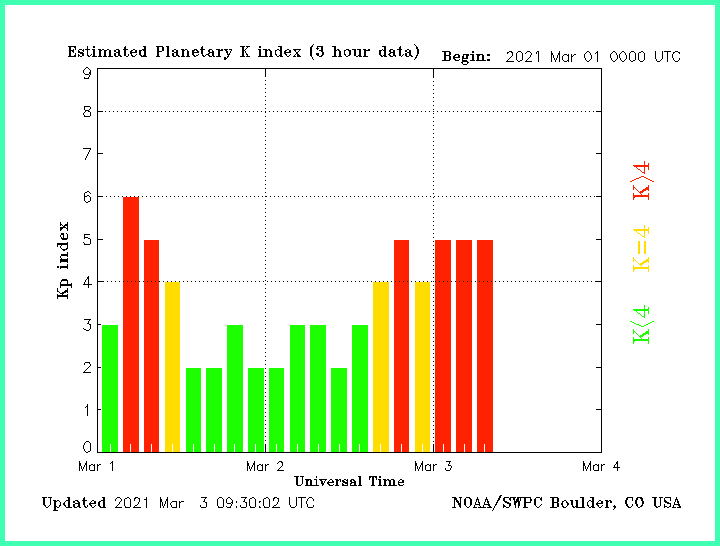
Planetary K-Index chart for Boulder, Colorado, USA, on March 1, 2021 / NOAA
Here is combined data from the two systems:
Green: Planetary K-Index 0–4 — calm or small geomagnetic disturbance
No effect on devices or people.
Yellow: Planetary K-Index 5 / G1 — weak/minor geomagnetic storm
Weak fluctuations in the electrical grid, minor effects on the operation of space satellites, as well as on the migration of animals are quite possible. Northern Lights are usually seen at high latitudes (e.g., Michigan and Maine in the United States).
Dark yellow: Planetary K-Index 6 / G2 — moderate geomagnetic storm
Power systems located at high latitudes can experience emergency situations. Prolonged geomagnetic storms can damage transformers. High-frequency (HF) radio signals may weaken at higher latitudes. Northern Lights are observed at latitudes in New York State and Idaho in the USA.
Orange: Planetary K-Index 7 / G3 — strong geomagnetic storm
False alarms may be triggered on some protective electronic devices. Correction of satellite orientation in outer space may be required. Satellite navigation problems may occur, and radio communications may be disrupted. Northern Lights are observed in Illinois and Oregon in the USA.
Red: Planetary K-Index 8 / G4 — severe geomagnetic storm
There may be widespread problems with power grid voltages. Satellite navigation may worsen for several hours, and low-frequency (LF) radio navigation may be disrupted. Northern Lights are observed in Alabama and northern California in the USA.
Dark red: Planetary K-Index 9 / G5 — extreme geomagnetic storm
Particular power systems may experience transformer damage and a complete collapse or blackout. High-frequency radio communications may not be possible in many areas for one or two days. Satellite navigation may be disrupted for several days. Northern Lights may be observed in Florida and southern Texas in the USA.

Planetary K-Index chart. The source of the data: Space Weather Prediction Center (SWPC) of the US National Oceanic and Atmospheric Administration (NOAA). Valerya Milovanova / Windy.app
NOAA uses the scale to decide whether to issue K-Index Watches, Warnings and Alerts to users who are affected by these disturbances to warn about potentially dangerous situations depending on the strength of the indices, but usually already after the value of 4 or higher.
The bottom line: Following Kp-Index and warnings from NOAA and other meteorological services, it is best to minimize the use of vital electronic devices, such as GPS navigators — for example, during marine navigation or land expeditions through wilderness areas without marked trails or roads, and to plan with caution various outdoor activities on the days of severe geomagnetic storms, and similar.
Where to get geomagnetic storms forecast?
You can find the geomagnetic storm forecast in various apps for the general weather forecasting for a dailylife, traveling and other purposes.
Important: the presentation of the data in the apps may be slightly different from the official K-Index and NOAA G-Scale. The numbers and their meaning could be the same, but you could find a bit different colors in the index.
Text: Ivan Kuznetsov, an outdoor journalist, editor and writer from the Dolomites, Italy, and Karelia, Finland, with 10 years of professional experience. His favorite sports are cycling, hiking and sauna. Read his other articles
Cover photo: History In Hd / Unsplash
You will also find useful
The reversal of Earth's magnetic poles. When and how they will flip
Looking at the stars. Where and when
Why do we see halo — a circle around the sun
Latest News
Professional Weather App
Get a detailed online 10 day weather forecast, live worldwide wind map and local weather reports from the most accurate weather models.
Compare spot conditions, ask locals in the app chat, discover meteo lessons, and share your experience in our Windy.app Community.
Be sure with Windy.app.


