How to use weather history for better weather forecasting
Learn what is weather history, why do you need it for weather forecasting and where to get it in Windy.app.
What is weather history?
The history of the weather is statistical data on the state of the atmosphere and the ocean, collected on the basis of regular meteorological observations made from hour to hour, day to day, month to month, year to year — continuously.
The purpose of data collection is the same as any other statistical information: to better understand the current weather situation and make better forecasts.
For example, by comparing the wind speed in a particular area over the past few years, we can identify patterns like "the wind blows mainly in the same direction and with the same speed". The conclusion: it will continue to blow in the same way. If the wind is unstable, it is more difficult to predict the weather.
Why do I need to use past weather data?
Forecast and reality often don't match. Sometimes we need to look at the real weather at some particular point. And what could be wrong with that?
The weather is monitored all over the world. There are a lot of sources: weather stations, satellites, weather balloons, ships, aircraft and other, datasets of enormous size. However, there is a problem: these records are not evenly distributed around the globe.
- What was the wind strength on August 8, 2020, at my location? Or on another particular day?
- I am planning a trip: what is the weather usually like at that place?
- There is an outdoor activity I want to do in the next 1—3 days. (It is easy because you have the forecast.) But what about the distant future: 5, 7, 10, 14 days or even more?
- I'm a future weather expert, a student looking for historical weather reports, or global average temperature history. Where to look for?
- I'd like to go sailing in an unfamiliar area: what is the wind pattern there?
Knowing weather history can help you with these questions. Thanks to it, you can compare the actual weather on any date to the normal weather in past years. So you need to know the weather history for the same thing — for better weather forecasting.
Important: remember that in some regions the weather changes frequently and significantly. In Iceland, for example, you can get only a primal understanding of the conditions of wind and precipitation. But in other places (in Japan in winter, in Southern Europe in summer, etc.) the weather is pretty constant from year to year. In these places, historical data can sometimes be used as a rude forecast.
And in general, the weather is cyclic. In the same regions of the earth at the same time periods, it is approximately the same. Yes, in the southern regions may snow, but usually, it is very hot there, and in the north — cold. Somewhere, like in Tarifa, the wind is always blowing, so it is one of the best places in the world for kitesurfing. Somewhere, like in California, the best waves. And so on.
What is historical weather data in Windy.app?
In Windy.app weather history is the weather that occurred on a spot in the past. This data is taken from the forecast for the spot and is available since 2012.
Before 2021, the history used to be old GFS27 global model forecasts. From year 2021, we give you a completely different past weather data — reanalysis of the ECMWF — #1 global weather forecast model.
The difference with the previous forecast is that ECMWF works "backward" in time and processes all available weather observations made in past. The result is comprehensive retrospective weather data for any point on Earth for every 3 hours.
The feature is called Weather Archive.
What do I get in Weather Archive in Windy.app?
In the Archive you can find
- wind speed,
- wind gusts,
- wind direction,
- day and night temperatures,
- clouds base,
- precipitation sums.
Wind and temperature are available as monthly (weather history by month) and daily means (weather history by date), precipitation is available as monthly and daily sums.
These statistics are based on historical data observations and were created for windsurfing, kitesurfing, sailing, and other extreme sports activities. All statistics update every year and can help to find the best place for any wind and water sport.
How to find past weather reports in Windy.app?
In Windy.app you can get Weather Archive in two places: for a particular spot (and other locations) and for the world on the Wind and Precipitation Map. You can read about how to use the weather archive on the website in our guide.
Let's take iOS as an example:
Weather archive for a spot (other location)
In the app
1. Choose and open any spot, scroll down the screen, find and tap on the Archive icon.
2. On the first Archive screen you see the wind direction and wind speed history for each month for the last years, as well as the wind, rose showing the same, but in a different way. Learn how to read wind rose in Windy.app.
3. Slide from the left to the right of the screen to see the colors and numbers of wind speed.
4. At the bottom of the first screen tap Detailed archive to see more data.
5. On the archive second screen you see the same historical weather records, but for each day of the month. Plus: wind gusts, atmospheric pressure at sea level, clouds base, and precipitation. Choose any day to see how the wind rose will change.
On the website
You can check windy historical data and temperature history (but, in this time, no historical precipitation data) for any spot on the Windy.app website. It contains the same detailed information about the average local wind speed and air temperature. The same wind rose on the map shows a dominant wind direction and includes average data for every year.
Here you also get free historical weather data by city. Let's take some examples:
- Weather history for Stockholm, Sweden
- Weather history for Los Angeles, Unided States
- Weather history for Sydney, Australia
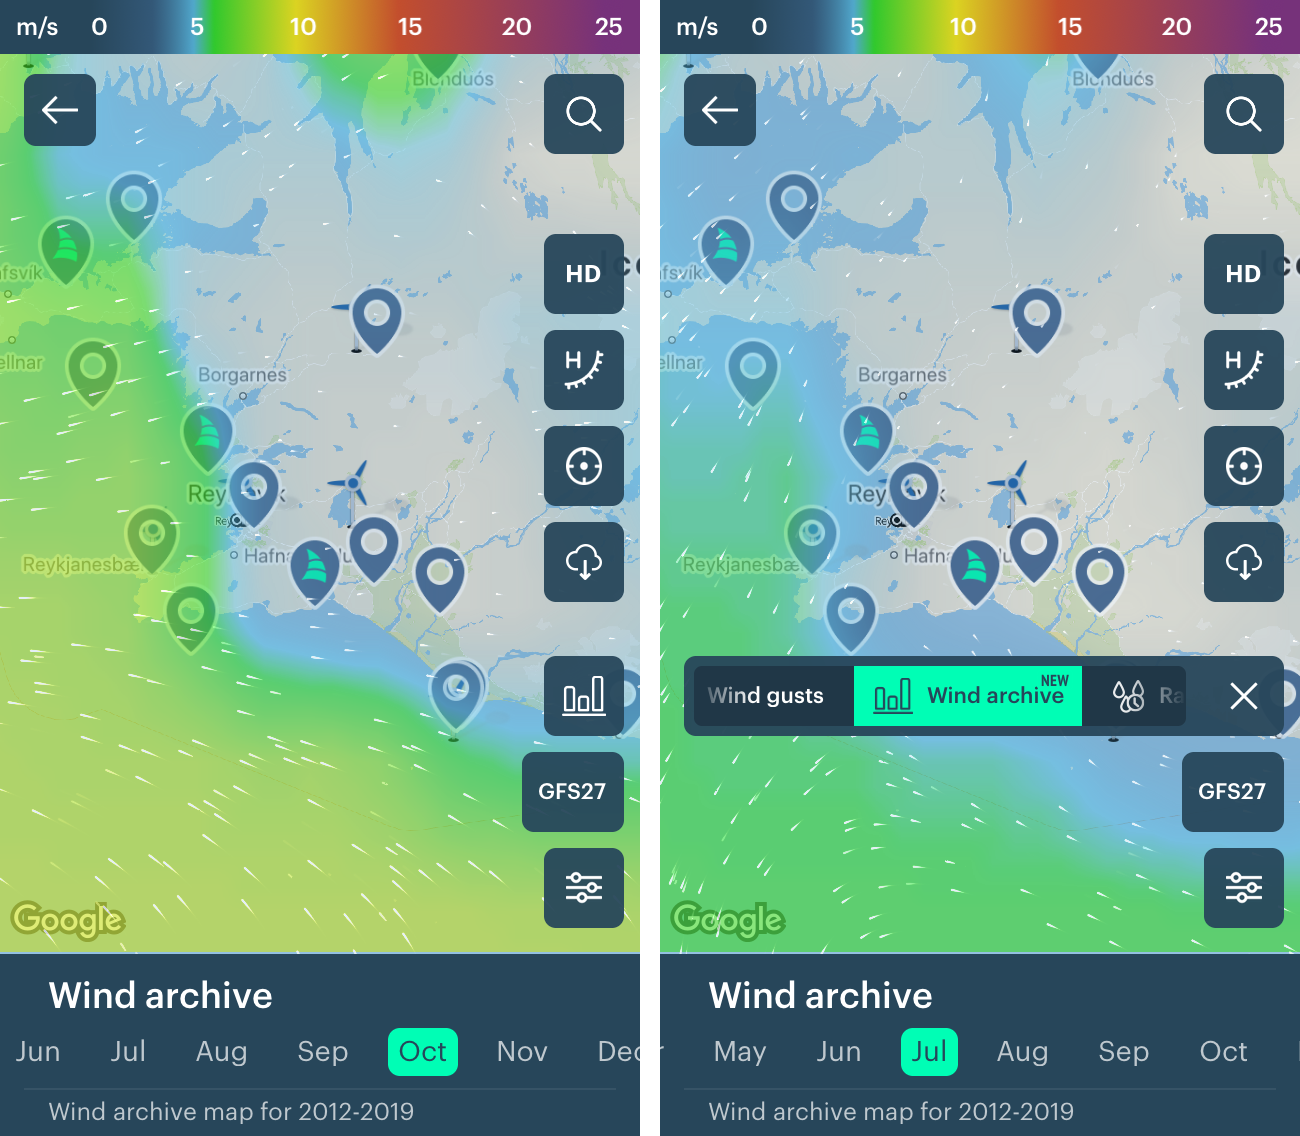
Wind archive for the world
1. Open the Wind and Precipitation Map from the same spot or the Home screen.
2. Tap on the Wind Gust Icon and choose Wind archive.
3. Here you get an average wind speed forecast for each month for recent years on a big wind map — so in a different way, then on the spot archive.

Read guide to the app. Follow us in a Facebook, Instagram, Twitter, LinkedIn, YouTube. Subscribe to our newsletter to get Windy.app Meteorological Textbook (WMT) with 50+ lessons on better weather forecasting and receive a new lessons right to your email once a week. Write your own post in the blog. Cooperate with the team, if you are a business or content creator.
Read more manuals to the app in Windy.app Guides.
Text: Evgeniy Petrov and Ivan Kuznetsov
Cover photo: haley-truong / unsplash
You will also find useful
Weather History — weather archive for the past years
Guide to weather parameters used in Windy.app
Latest News
Professional Weather App
Get a detailed online 10 day weather forecast, live worldwide wind map and local weather reports from the most accurate weather models.
Compare spot conditions, ask locals in the app chat, discover meteo lessons, and share your experience in our Windy.app Community.
Be sure with Windy.app.


