How to read a weather fronts map like an expert
Weather fronts map is the most common type of weather map, which in turn is one of the two most popular forms of weather forecasts, along with its presentation as a standard table. In this article, you will learn more about what a weather fronts map is and how to read it like an expert.
What is a weather fronts map?
Weather fronts map is the most common type of weather map that shows the distribution of weather fronts in the atmosphere over certain regions of the earth, as well as on the globe as a whole. In turn, a weather front is a place of collision of air masses, a boundary that is constantly in motion. The main thing to know about weather fronts is that they bring a dramatic change in weather, including those of the strength and direction of the wind. Clouds and precipitation are usually formed on the fronts.
A modern weather fronts map is a digital interactive (live) map you can get on some website or rather in a weather application for your smartphone and tablet.
With the development of digital technology, it is also has become possible to separate the weather fronts map from the other weather elements, as well as to create separate maps for many of them. Previously, on paper maps, the elements were combined on one general weather map that included wind, precipitation, temperature, cloud cover, and more.
The data you see on a typical weather fronts map is a forecast for today and, most often, the next 3–10 days from one of the several weather models, which, in turn, could be of one of the two main types: global with a forecast for the whole world and regional or local with a forecast for only some part of the world. For example, it could be a wind map for North America, the Mediterranean Sea coast, and the like.
Accordingly, a weather fronts map is needed to get the appropriate forecast in a visual form that the usual forecast table, graph, and other forms of presentation do not provide. It is also a way to get a bigger weather picture.

Weather fronts map for North America, North Atlantic Ocean, and Europe in the Windy.app for iOS
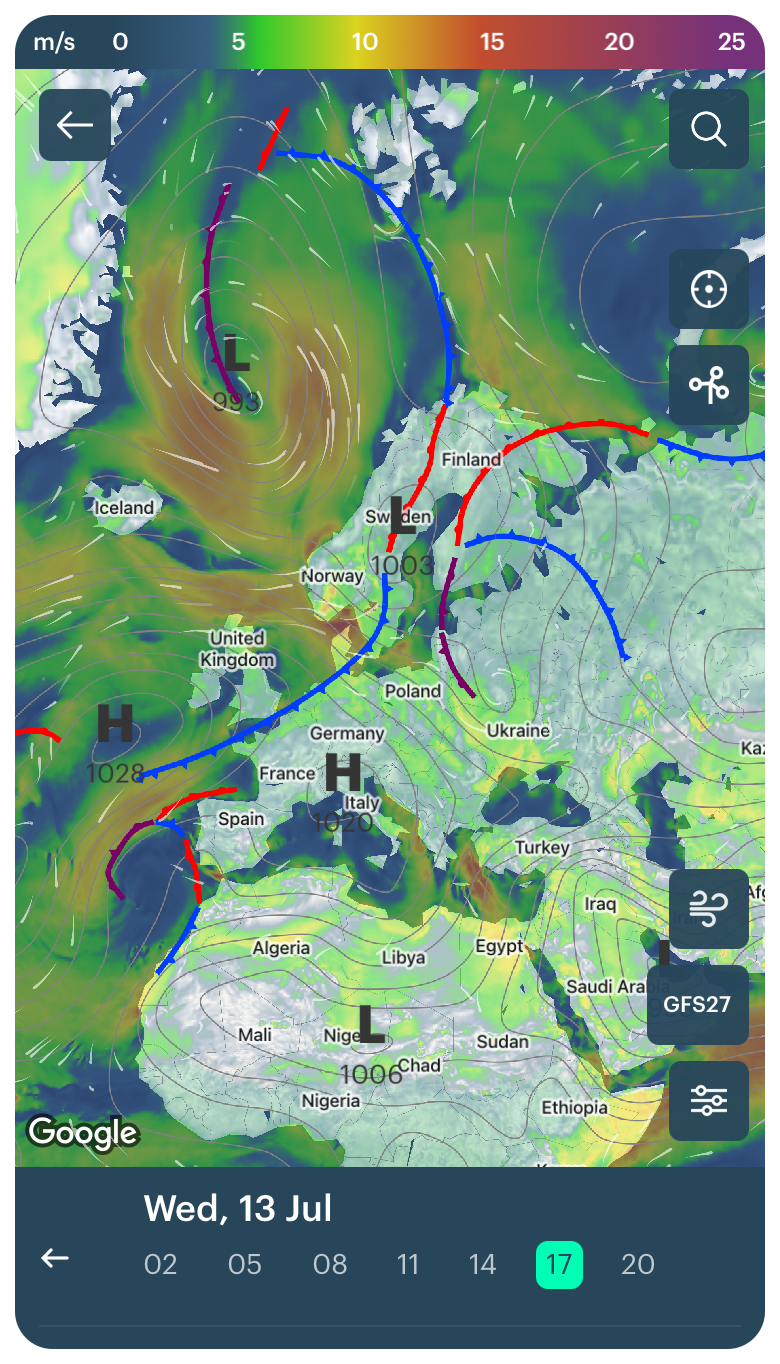
Weather fronts map for North America, North Atlantic Ocean, and Europe in the Windy.app for iOS
How to read a weather fronts map like an expert?
To read any type of weather map correctly, you need to know that there is no single weather map, there are many, and they look different with different information and visualization depending on the source.
However, the weather map generally consists of the following basic elements, so keep your attention on them, while reading the map:
- colors,
- special symbols,
- numbers,
- letters or phrases,
- lines,
- different interactive elements.
So, let’s figure out how to read a weather fronts map using the Windy.app as an example in 10 steps:
1. In the app weather fronts are available for the territory of North America and Europe, as well as the North Atlantic Ocean in between.
2. Weather fronts are represented by different colored lines on the map, similar to arcs, together with areas of high (H) and low (L) atmospheric pressure and isobars — the lines where the pressure is the same — we will return to them at the end of the instructions.
3. There are four main types of weather fronts: cold, warm, stationary, and occluded. But before telling about them, let’s answer the logical question: why lines and not something else? It’s simple: the weather front area is very narrow compared to the air masses itself like tens of kilometers (miles) versus thousands of kilometers (miles). So it is a big difference in size. For this reason, weather maps depict weather fronts as lines. So how do meteorologists label different kinds of weather fronts?
4. Red lines are warm weather fronts. They form when warm air moves into cold air territory. Warm fronts pass with overcast, rains, sometimes with thunderstorms.
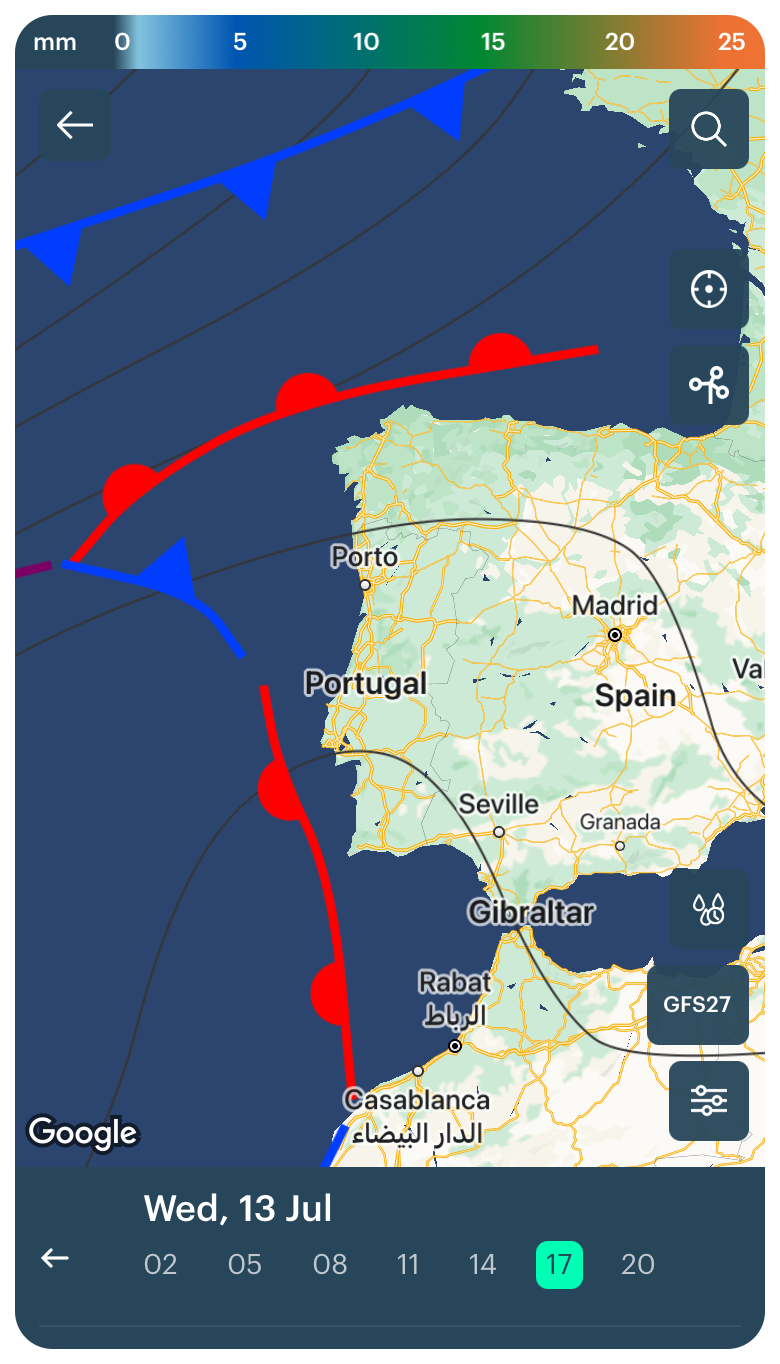
Warm fronts on a weather map for the coast of Portugal and North Africa in the Windy.app for iOS
5. Blue lines are, respectively, cold weather fronts. They are formed under a reverse situation: cold air moves into warm air territory. It brings colder air and good visibility.
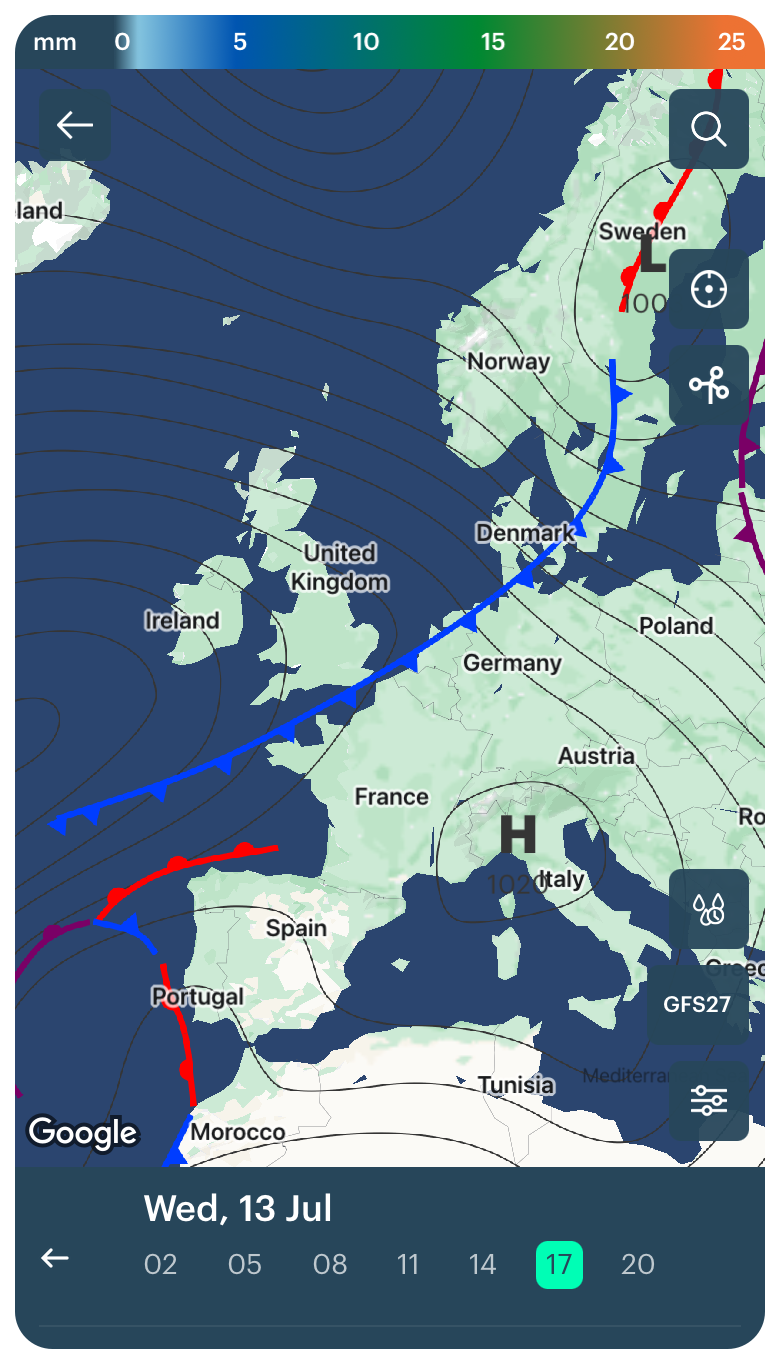
Cold fronts on a weather map for Northern Europe in the Windy.app for iOS
6. The red and blue lines together are stationary weather fronts, that is, the mix of warm and cold fronts with one or the other type of air, and one or the other weather prevailing.
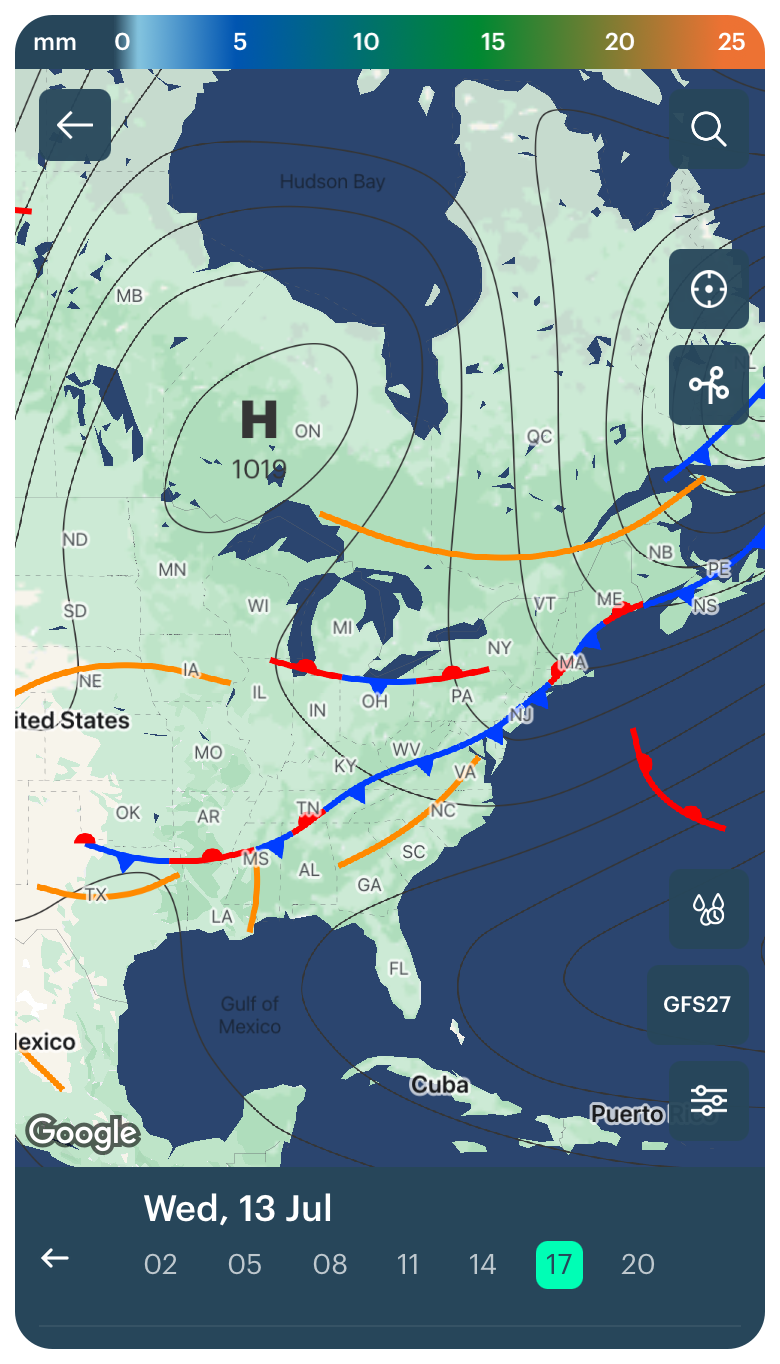
US weather map with fronts of the stationary type in the Windy.app for iOS
7. Purple arcs are occluded weather fronts, that is, fronts that will appear in the nearest future — they will become red (warm) or blue (cold).

Weather map showing fronts of occluded type in Eastern Europe in the Windy.app for iOS
8. The orange lines are not fronts but low-pressure troughs. Troughs mark areas where the air is particularly unstable, it is turbulent or moving around. There could be showers with this type of air, therefore they don’t mark any boundary in the same way that a front does.
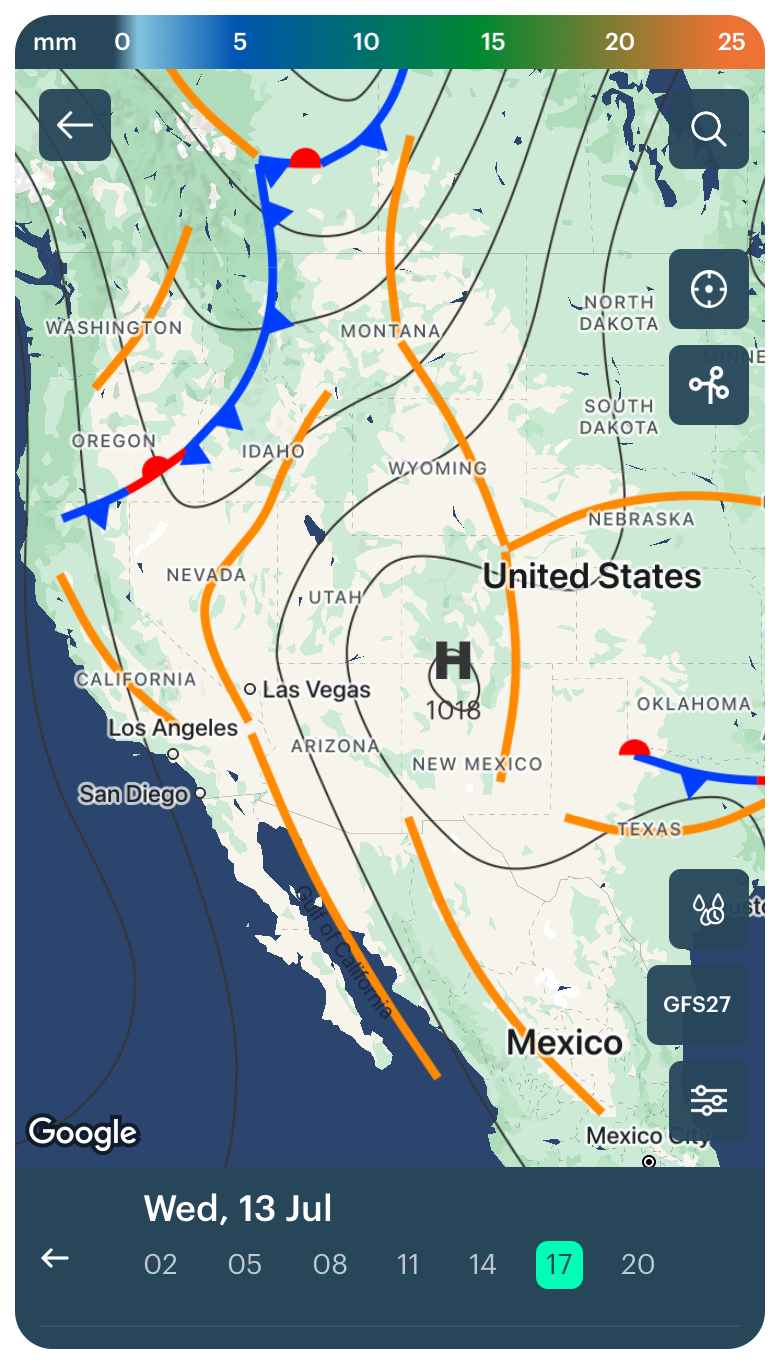
Weather map with fronts and troughs in the US in the Windy.app for iOS
9. Another important thing is triangles and ovals (semi-circles) on weather fronts. They show their direction, that is, where this or that mass of air is moving. Warm fronts are traditionally indicated by ovals, cold fronts by triangles or both in the case of the stationary "mixed" weather fronts. Ovals and triangles on different sides of the line mean that the front is not moving.
10. Remember isobars, lines with the same atmospheric pressure? They go in tandem with the weather fronts on the map because they are directly related to them, so it’s a dual function in the app. One makes it better to understand the other, and vice versa. For example, stationary fronts are located between two high-pressure areas, parallel to isobars. To find out the exact pressure values, zoom in on the map.
Learn more about atmospheric pressure, its high and low areas, and how to read an isobar map, as well as a wind map.
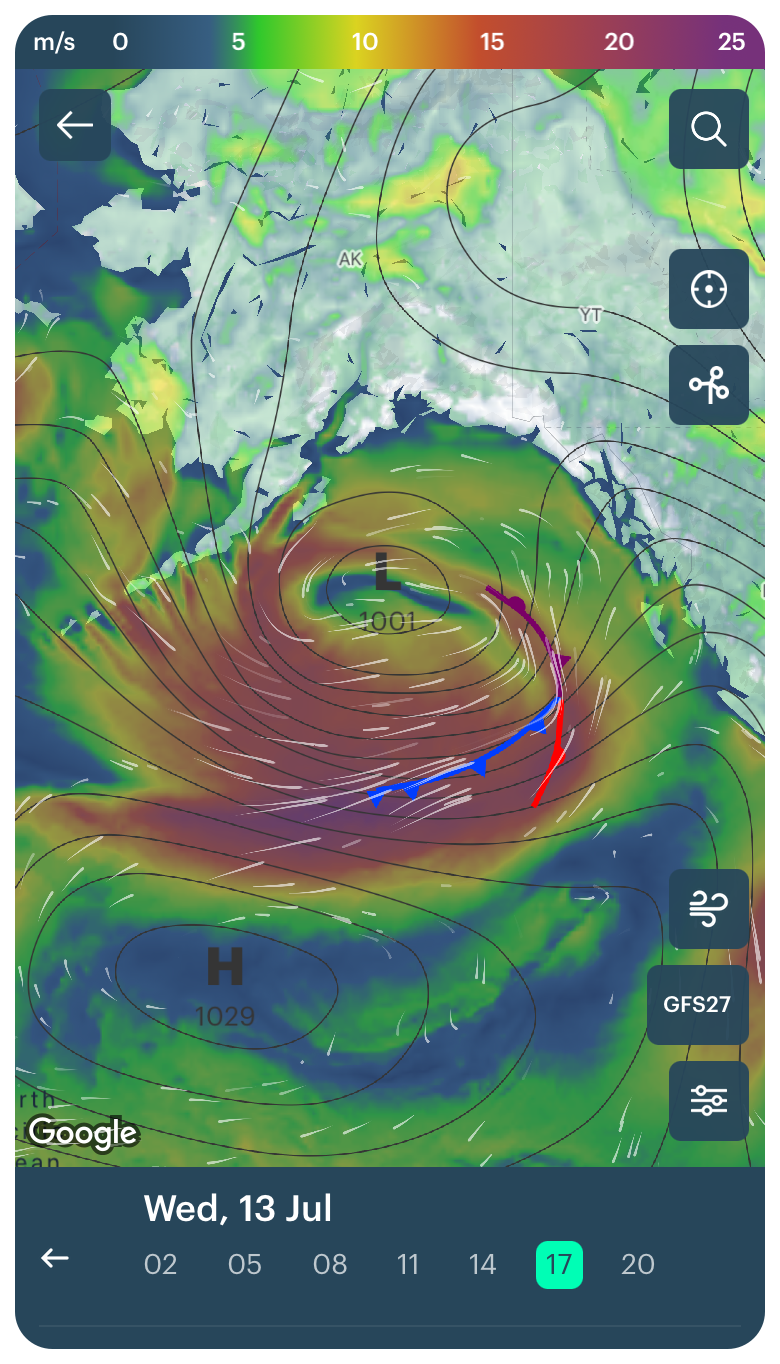
Weather map with fronts and isobars for Alaska, USA, in the Windy.app for iOS
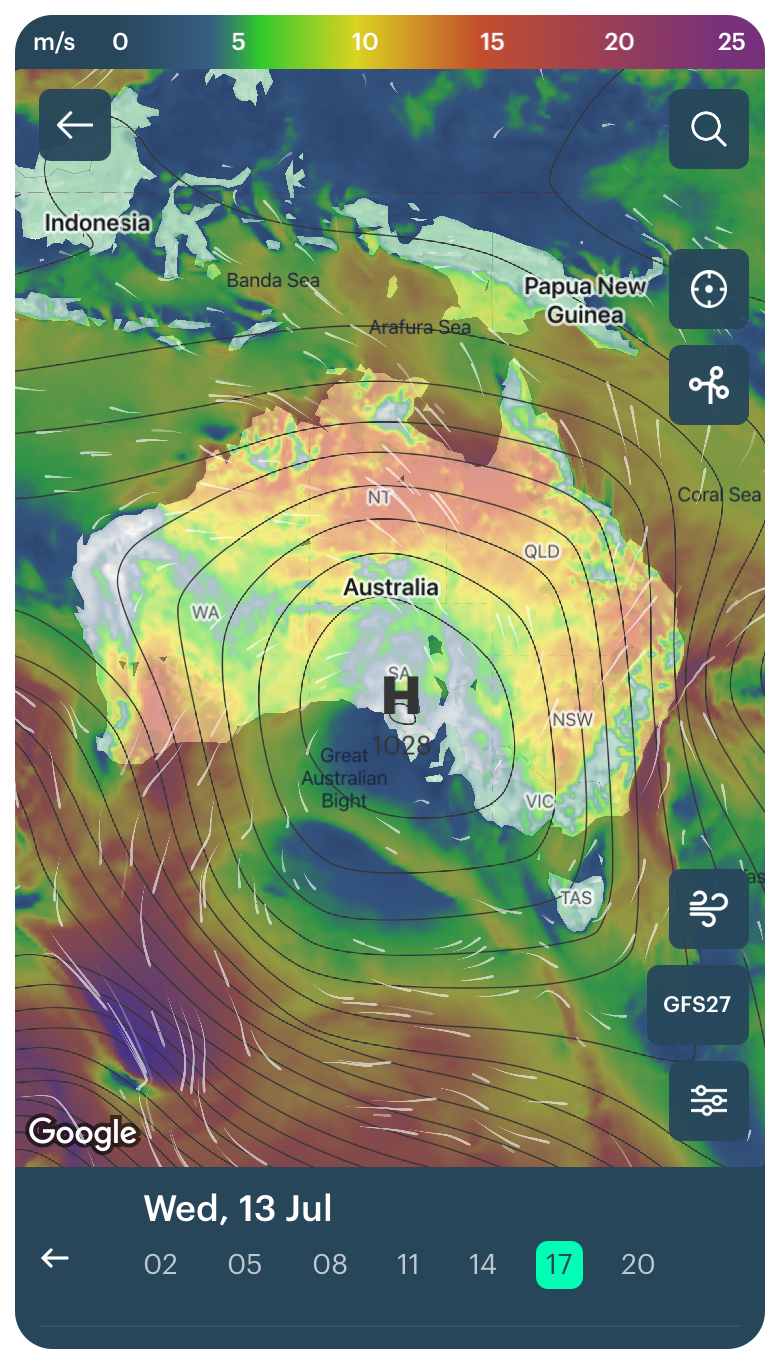
Weather map with fronts and pressure systems for Australia in the Windy.app for iOS
Where to get a weather fronts map?
From the Home screen or from the Spot screen in the Windy.app, go to the Weather Map and then to its Settings and select the Weather Fronts and Isobars layer. Adjust the map’s transparency settings to get a better look at the details of the map. You can also change the layer from Wind to Precipitation for better visibility.
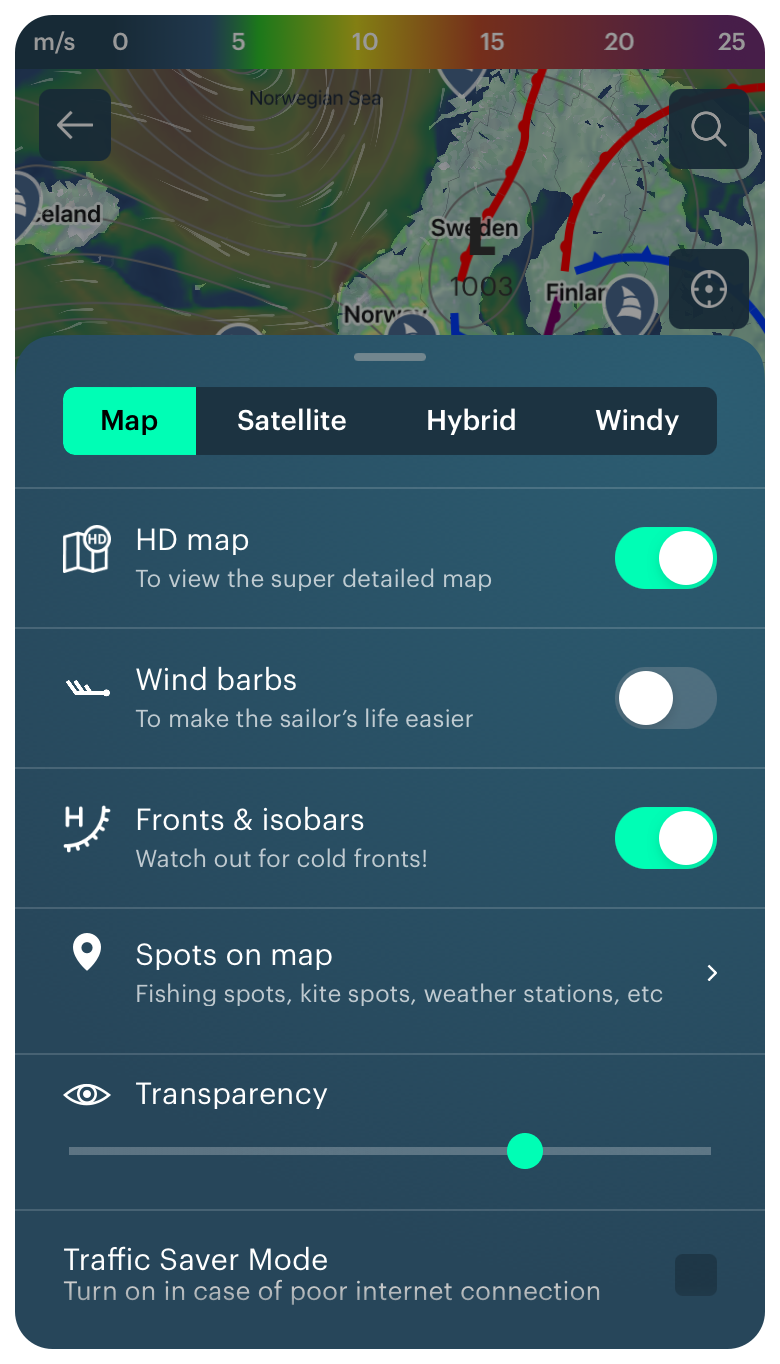
Settings of the current weather map with fronts in the Windy.app for iOS
Text: Ivan Kuznetsov
Cover photo: Jason Abdilla / Unsplash
You will also find useful
Feature: Weather Fronts for North America and Europe
Weather Fronts and Isobars — must-have features for sailing
Latest News
Professional Weather App
Get a detailed online 10 day weather forecast, live worldwide wind map and local weather reports from the most accurate weather models.
Compare spot conditions, ask locals in the app chat, discover meteo lessons, and share your experience in our Windy.app Community.
Be sure with Windy.app.


