
Tidal range — a must-know concept when studying the nature of tides
In addition to the two main concepts related to tides — high tide and low tide, respectively — there are more than a dozen others. The tidal range is the third most important thing, which comes from the first two, as you might guess.
In this article, we will understand what it is, how it is classified and measured, and which place has the largest tidal range in the world.
What is the tidal range definition?
The tidal range is one of more than a dozen parameters by which tides are measured. It is the height difference between a high tide (rise in water level) and a low tide (fall) at any given location.
Just like the tides themselves, the tidal range is caused by two main things: the gravitational forces of the Moon and Sun in relation to the Earth, and the rotation of the Earth itself. In other words, tides are the “long” waves that go around the planet as the gravitational of the Moon and Sun “pulls” the ocean forward and backward as these celestial bodies interact with the Earth in their monthly and annual orbits.
But the tides, including the tidal range, are also dependent on time and place, that is, when exactly the tides occur, and on the features of the topography. We'll deal with the first right away, but as for the second, the tidal range is affected by such factors as shoreline configurations, water depths, ocean basin size, others.
The weather can also affect the tides. For example, stormy winds in one direction for long periods of time, combined with some other factors, can increase the tidal wave in narrow bays quite a bit and cause flooding.
For a general understanding of the topic, it is also important to know that in addition to the tidal range, tides are measured using such concepts as a tidal bore, tidal force, tidal power, tidal race, tidal resonance, tideline, and others.

Samuel Foster / Unsplash
How do we measure tidal range?
Tides are not fixed but change depending on the position of the Sun and Moon. But because the data about them is based on astronomical phenomena, they can be recorded and predicted. In other words, they have patterns.
Tides are measured by the national hydrographic offices such as NOAA in the US. They also publish tides data. One of the tidal datums (standard elevation defined by a certain phase of the tide) is used for calculations: MLW (Mean Low Water) for low tides and MHW (Mean High Water) for high tides.
Next, the most important thing: the largest tidal range occurs during a new moon or full moon when the gravitational effects of the Sun and the Moon on the Earth are the same (this is also known as syzygy) and reinforces each other. This condition is known as the spring tide or "King’s Tide", that is, the largest.
Don’t get confused: the name “spring” is only historical and has nothing to do with the season of spring. Spring tides occur twice in every lunar month throughout the year without regard to the season. However, the maximum tidal range throughout the year is possible on the day of the vernal equinox, when it coincides with the spring tide (that is, the new moon or full moon).
The second important thing is that exactly seven days after a spring tide, during the first and last quarter phases of the moon, there is a neap tide, when the sun and moon are at right angles to each other. During this period, the tidal range is the smallest throughout the year.
The tidal range is measured in meters (most of the world) and in feet (in the U.S. and some other countries).
Mike Giles / Unsplash
The main types of tidal range
Because of the topography, which is different in one place or another, the tidal range is unique to each place, but it is generally accepted to divide it into three main types:
- Micro tidal range — lower than 2 m (6.5 ft)
- Meso tidal range — from 2 m to 4 m (13.1 ft)
- Macro tidal range — higher than 4 m
Another common type you may see in different sources is the mean tidal range is the difference between mean high water (average high tide level) and mean low water (average low tide level).
The places with the highest tidal range in the world
It is logical to answer the question of where the strongest tidal waves on the planet come from. This is the Bay of Fundy, Canada, which is located between the provinces of Nova Scotia and New Brunswick. It is also partly in the state of Maine in the US. The exact coordinates are 45°00′N 65°45′W.
The Bay of Fundy's maximum tidal range during the year is 16 m (52 ft). Its mean tidal range is 11.7 m (38.4 ft). Is that a lot or a little? It is not just hight but extremely high considering that the average mean tidal range in the open ocean is about 0.6–1 m (2-3.3 ft). But it is higher near the coasts and can vary greatly.
To be quite precise, inside a 151 km (94 mi) long and 52 km (32 mi) wide funnel-shaped Bay of Fundy which helps draw in and give out water (remember the effect of topography on the tide?) is not one but a whole series of places with the highest tides. The above data refers to the Burntcoat Head Site, Minas Basin.
In contrast, some of the smallest tidal ranges in the world are in the Mediterranean, Baltic, and Caribbean Seas.
Previously, it was also thought that the farther away from the equator, the stronger the tides. This is not true. According to the same NOAA, there are many places in the far north and south latitudes that have small tides and a number of places closer to the equator that have large tides.
Where to find tides information?
You can find tidal data around the world in the Sail weather profile in the Windy.app. To open the profile, do the following:
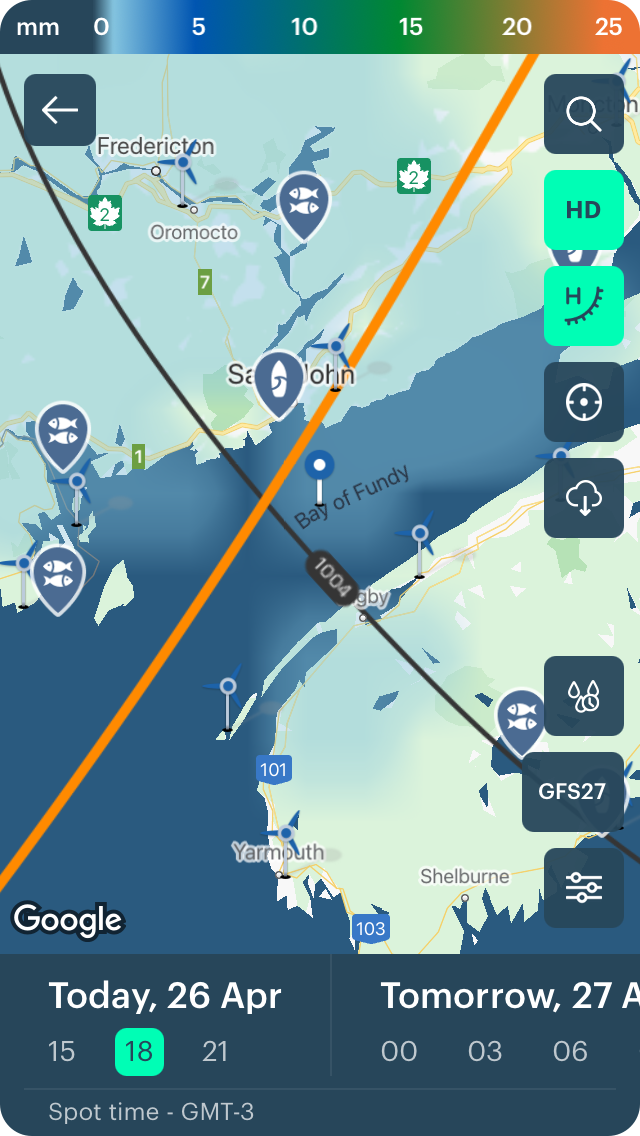
Bay of Fundy, Canada, tides forecast in the Windy.app for iOS
1. Select your favorite or nearby spot (marina or bay) on the Home screen of the app or on the Weather Map. Let’s take the same Bay of Fundy in Canada as an example. On the map, you can also immediately get the contacts of marinas by activating the Live Marinas feature.
2. Select a profile through the icon to the right of the weather models and scroll through the forecast table to the tides chart.
3. Get the forecast for the next 10 days, including the lowest and highest tides and their exact times. If the picture you see seems complicated to you, find out how to read tide tables in a separate article.
And also learn a lot more about how to read the surf/swell forecast in the special presentation of Windi with examples and tips from professional surfers with many years of experience riding the biggest and best waves.
Text: Ivan Kuznetsov, an outdoor journalist, editor and writer from the Dolomites, Italy, and Karelia, Finland, with 10 years of professional experience. His favorite sports are hiking, cycling and sauna. Read his other articles
Cover photo: Nick Van Der Ende / Unsplash
You will also find useful
The beginner's guide to types and purposes of yachting boats
How to get first-time skipper experience and prepare yourself for sailing
Latest News
Professional Weather App
Get a detailed online 10 day weather forecast, live worldwide wind map and local weather reports from the most accurate weather models.
Compare spot conditions, ask locals in the app chat, discover meteo lessons, and share your experience in our Windy.app Community.
Be sure with Windy.app.


