Learn to read a tide table so you don't run aground (or end up in the sea)
To predict tides we use tides tables — the main tool for getting information about tides. Let's learn more about what it is, how to read a tide table, and where to get reliable tide forecasts for your sport or outdoor activity.
What is a tide table as a source of information about tides?
Tides are periodic fluctuations of ocean level that occur once, twice, or four times a day depending on the place. It is a result of changes in the position of the Sun and Moon relative to the Earth and the effect of their gravitational forces on the ocean. Learn more about how tides work from this article.
To predict tides we use tides tables, also sometimes called tide schedule, prediction, report, forecast, etc. This is the main source of information about tides. And also Windy.app team made a presentation about how to read the surf/swell forecast with examples and tips from professional surfers with many years of experience riding the biggest and best waves.
Tide tables show high and low tides, indicating the time and height of these water level for a particular coastal area. These tables make it possible to pre-calculate the time and heights of high and low waters, as well as the heights of levels at intermediate moments with sufficient accuracy for practical purposes.
Tide tables are necessary for everyone, including outdoor enthusiasts practicing different types of sports, mainly water sports, but not only. For example, in:
- Yachting — so that you don't run aground and reach the port safely.
- Fishing — so that you know the level of water and catch as many fish as possible.
- Surfing — so that you aren't carried away far from the shore.
Tide tables are needed even for those who hike or do coastal walking — so that you correctly calculate the time at which you can safely walk through a route on the shore or make a fire by the ocean.
Important: Don't confuse tide tables with another source of tide information — tide charts. These are maps that show water levels throughout a bay at a particular point in time. These maps normally show water levels on an hourly basis after high tide. Tide charts are only available for certain territories and may be classified.
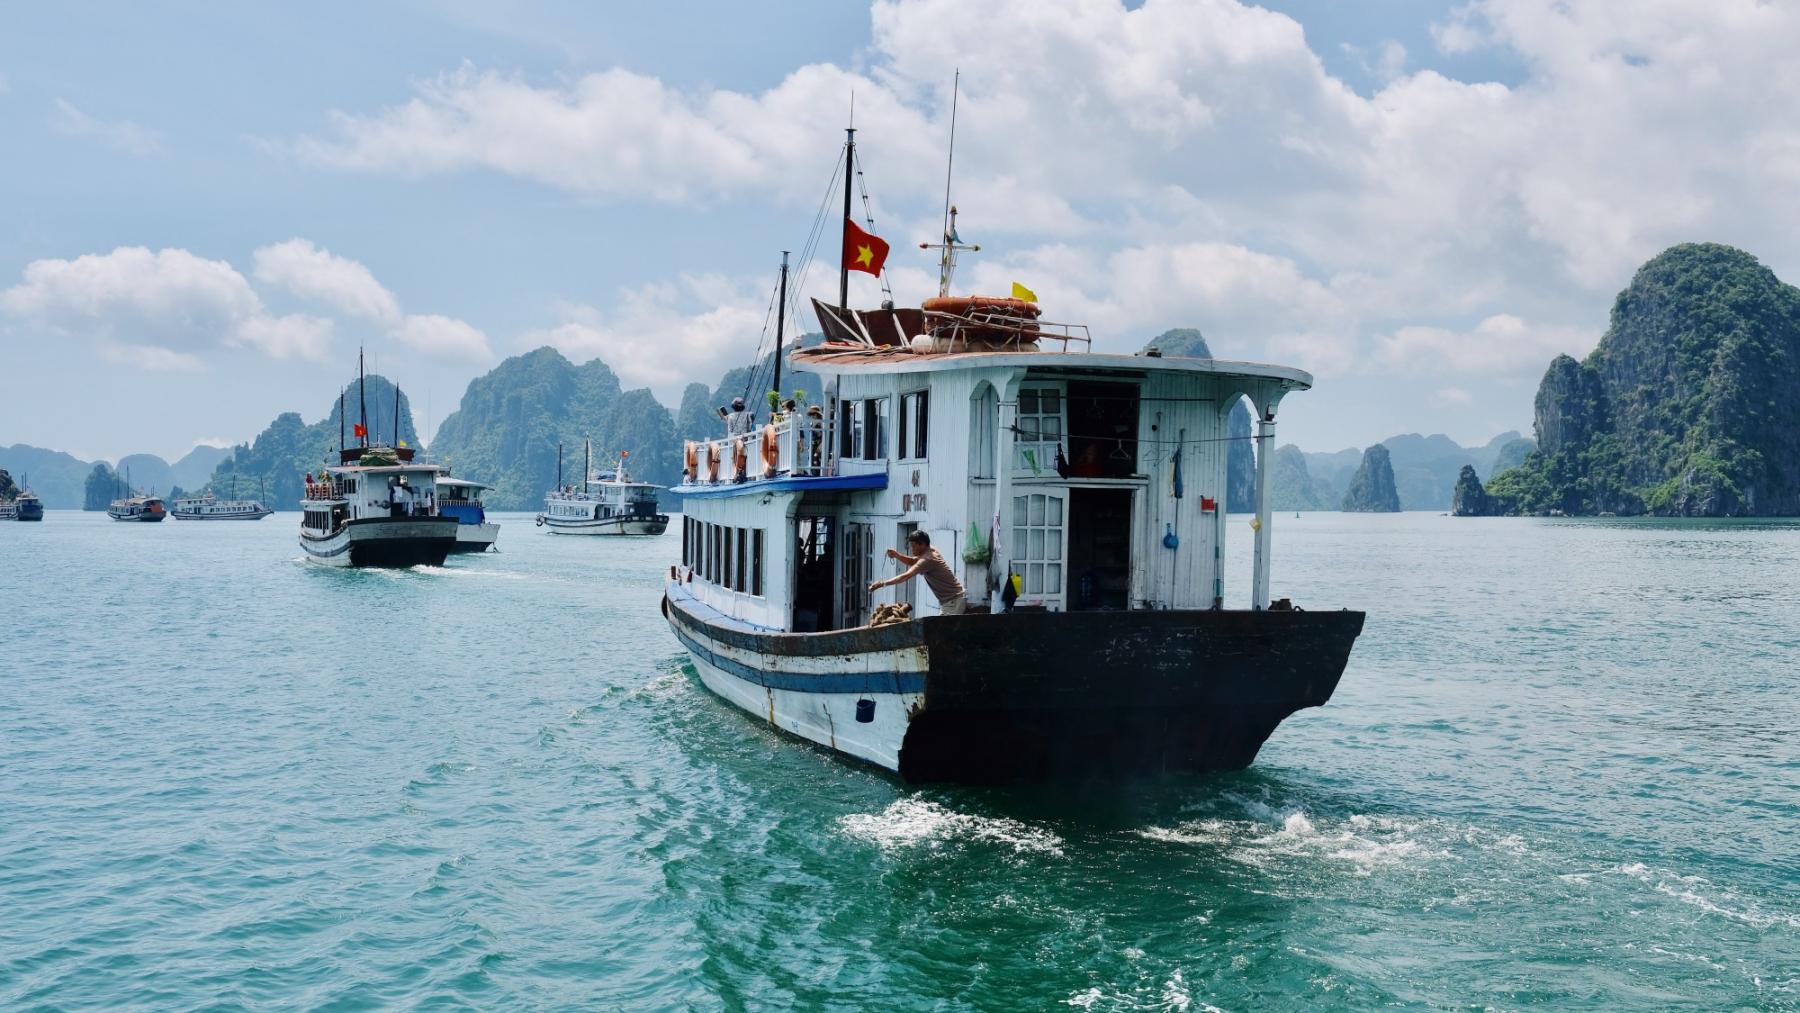
Photo: Hai-nguyen / Unsplash
How to read a tide table?
Depending on location, high and low tides may occur once, twice, or even four times a day. These "four times" tides are called semidiurnal tides and are common on the east coast of the United States.
The tides are semidiurnal, meaning they have two highs and two lows each day with about six hours and 13 minutes between each high and low tide. So usually, the tide table for one day is four times and four corresponding heights in feet or meters, and also a “high” or “low” mark. Time indicates when the water level in this location will reach a maximum or minimum.
Let's take as an example a tide table of the place with the highest tide in the world — Burntcoat Head in the Minas Basin in the Bay of Fundy between New Brunswick province and Nova Scotia province and peninsula, Canada. The mean tide range for this place is around 38.4 ft (11.7 m).

Photo: NOAA
At the same time, some tides are higher than others in this bay, because, as we have already learned, it also depends on the position of the Moon and the Sun, and weather conditions. So it has extremely high tides of about 50-52 ft or 16-17 meters during some parts of the month.
To see how much it is, look at this: The average tidal range worldwide is "just" about 3.3 ft (0.9-1 m). Or here is another example: In a single tidal cycle of the same 12 hours, about 110 billion tons of water flow in and out of the Bay of Fundy. It is like a 24 hr flow of all the rivers of the world!
The extremely high tides in the Bay of Fundy occur because the size of the bay is perfect to match the natural gravitational cycle of the Moon that causes the tides.
So the boats in the Bay of Fundy looks exactly like this during low and hight tides:
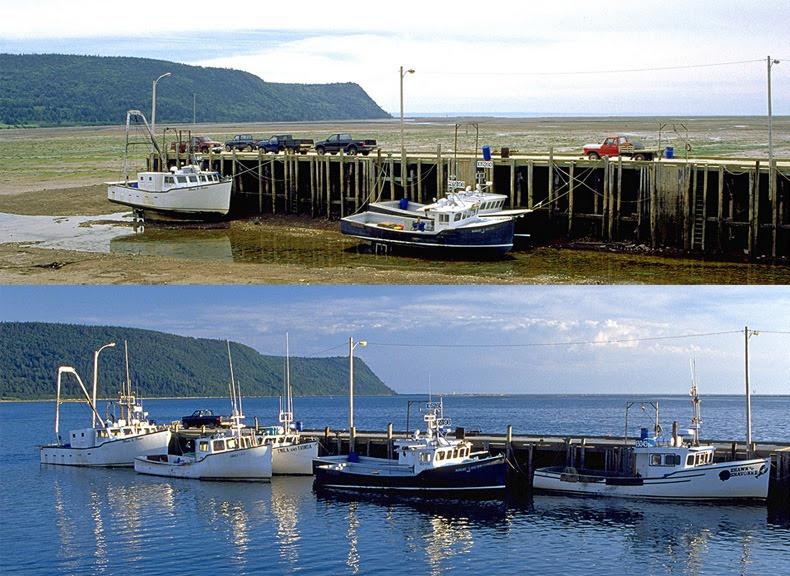
Photo: Steve Brown / Flickr
And this is the tide table for Burntcoat Head, Bay of Fundy with the tide forecast for the day of the publishing of this article and the next two days (3 days forecast):
Aprile 26, 2021
- 05:30 — low tide: –2.4 ft
- 11:40 — high tide: 22.4 ft
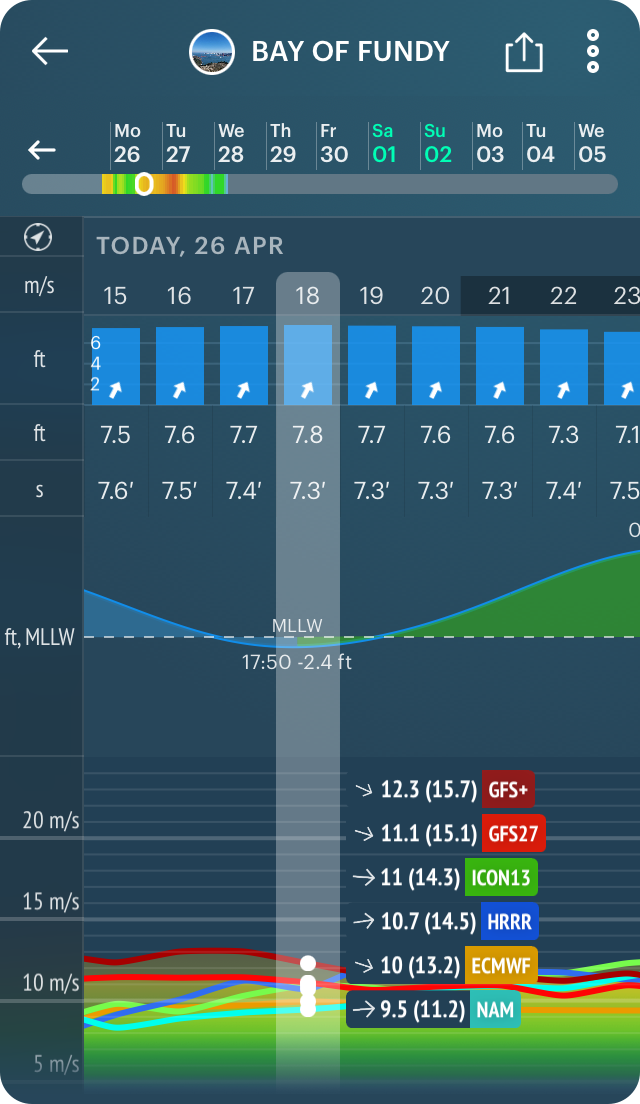
- 17:50 — low tide: –2.4 ft
April 27
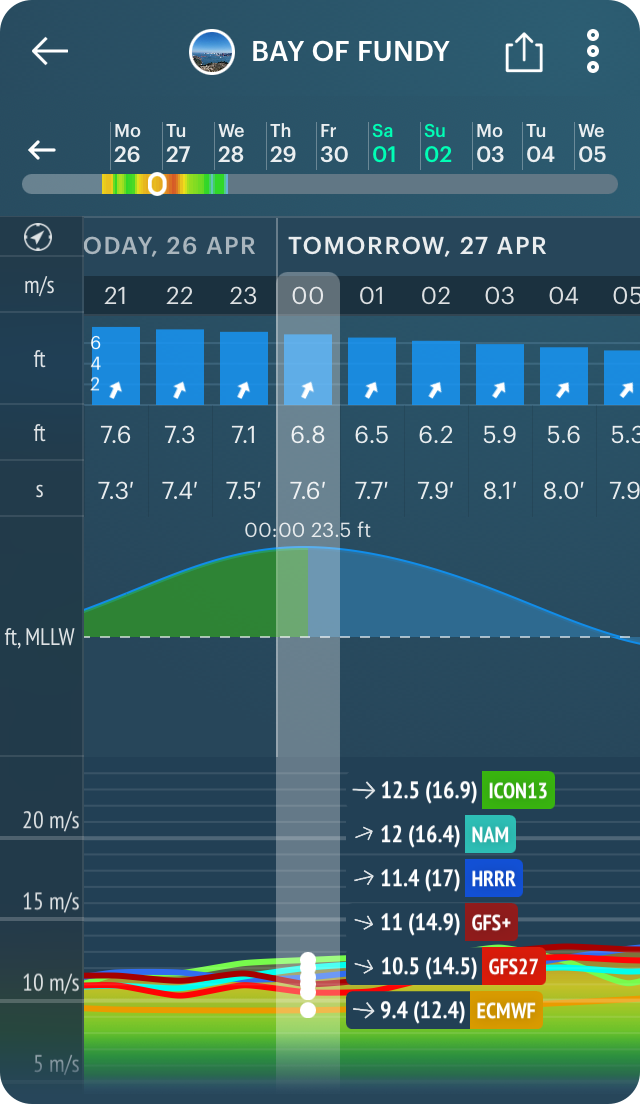
- 00:00 — high tide: 23.5 ft
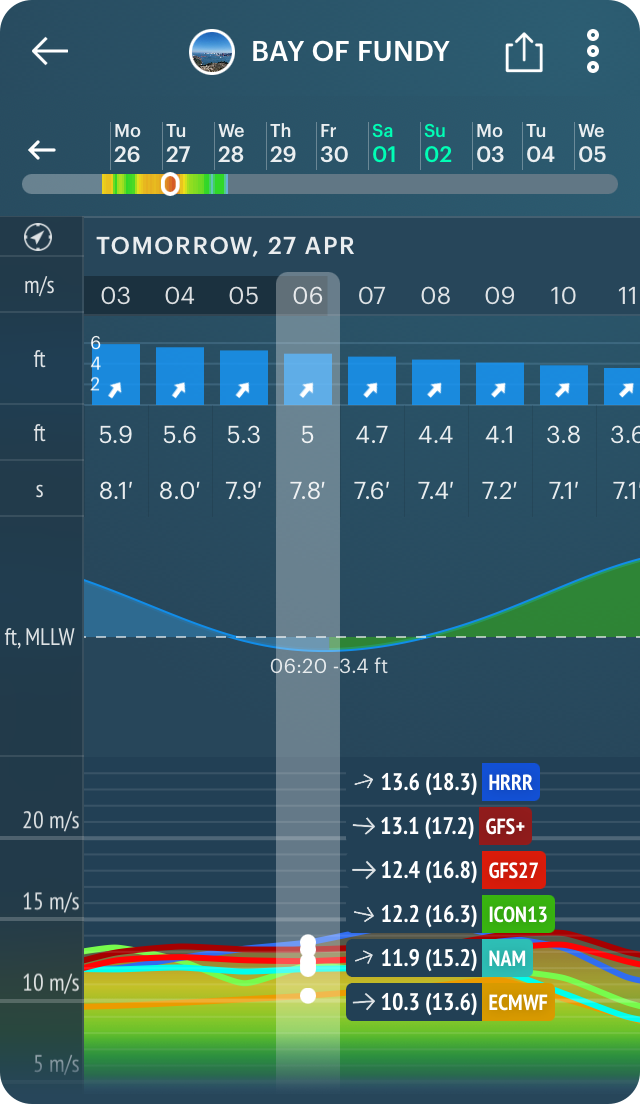
- 06:20 — low tide: –3.4 ft
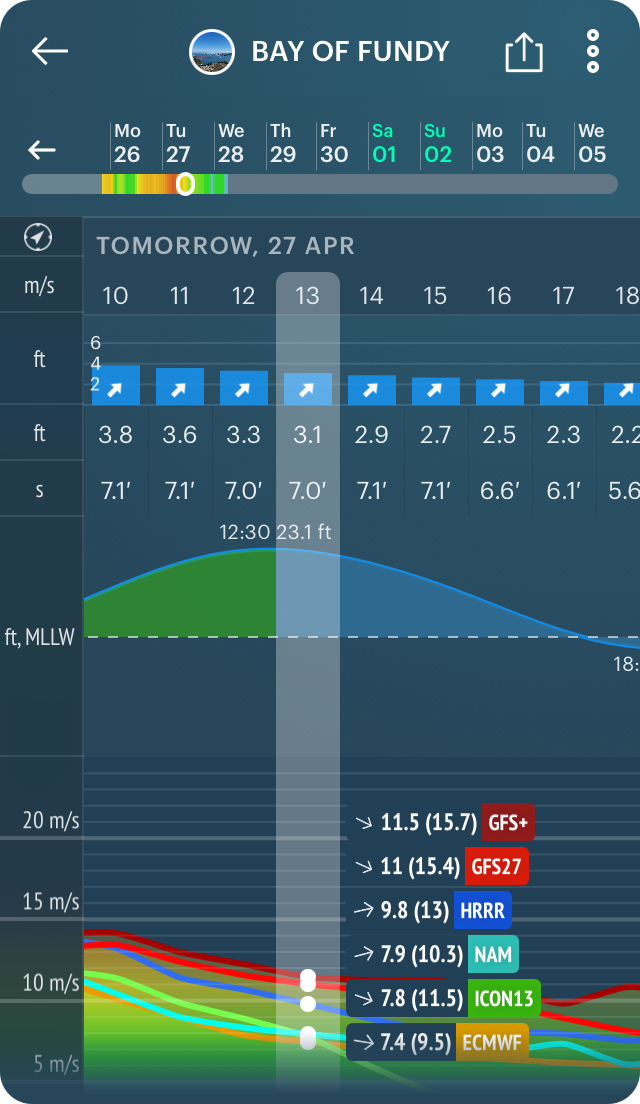
- 12:30 — high tide: 23.1 ft
- 18:40 — low tide: –2.9 ft
April 28
- 00:50 — high tide: 24.2 ft
- 07:10 — low tide: –4 ft
- 13:20 — high tide: 23.2 ft
- 19:30 — low tide: -2.8 ft
April 29
- 01:40 — high tide: 24.3 ft
So in the tide table example for the Burntcoat Head in the Bay of Fundy, we see that:
- At 05:30 am on April 26, the water level is at minimum and equal to -2.4 ft below MLLW. It is the current water level at the time of publication of this article and it is one of the two low tides during the day.
- Then the water level gradually increase and by 11:40 am on the same day there is the first high tide of the day — 22.4 ft.
- Then it start to decrease again and by 17:50 am it is the second low tide for the day of the same -2.4 ft.
- Finally, by 00:00 am it reach its day maximum — 23.5 ft. It is the second high tide of the day, which is actually the beginning of the next day, April 27.
Reading the tide table like this, we can see how the low and high tides will continue to succeed each other during the next two days — April 27, 28, and 29.
A reasonable question: What is MLLW? It is tidal datum or what's taken for zero depth. There are quite a few such datums in the world. The MLLW or (Mean Lower Low Water) is one of the two of the most common in the world on pair with LAT (Lowest Astronomical Tide). The LAT is used globally, the MLLW is used mostly in the US and North America. That's why we take this datum as an example in the table.
Learn more about these two tidal datums from this article.

How to read a tide table. Valerya Milovanova / Windy.app
Where to get a tide forecast?
There are both tide table and tide graph in the Windy.app, so you can plan your sailing or a fishing trip, or surf ride, or hiking adventure route with the tide timeline in mind to stay safe in the water or ashore. The tide forecast is easy to find and read in the app:
1. Find a spot near your current location by searching on the Home screen or Wind and Precipitation Map. To do this, first enable the "Geolocation" function in the "Settings". Then, to make a spot favorite, click on "star" icon:
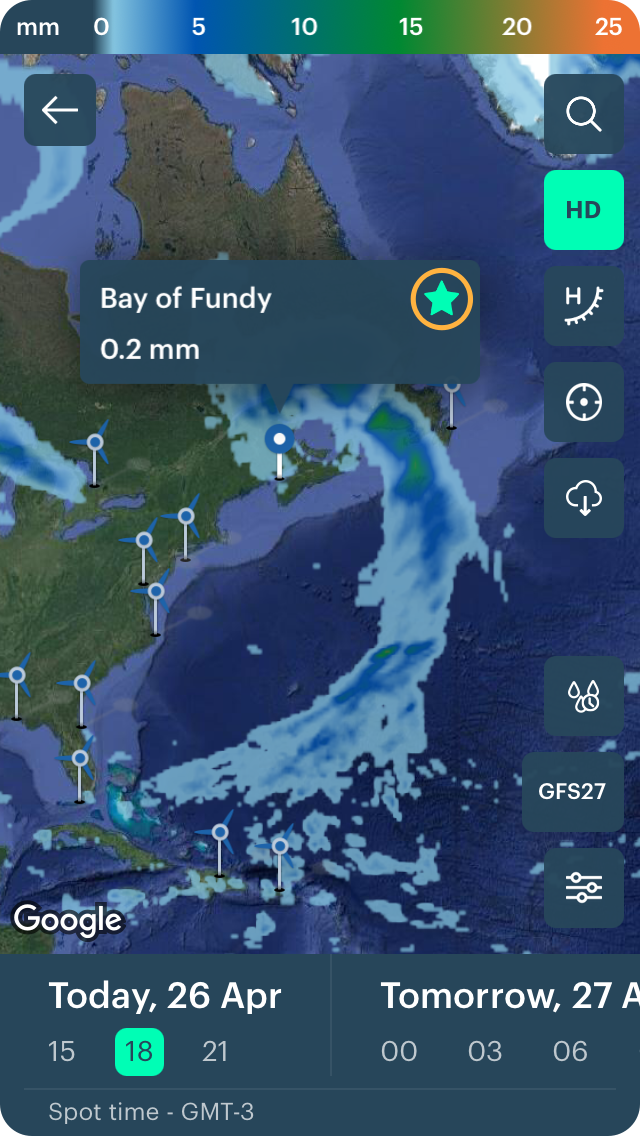
Let's take as an example the same Bay of Fundy in Canada:
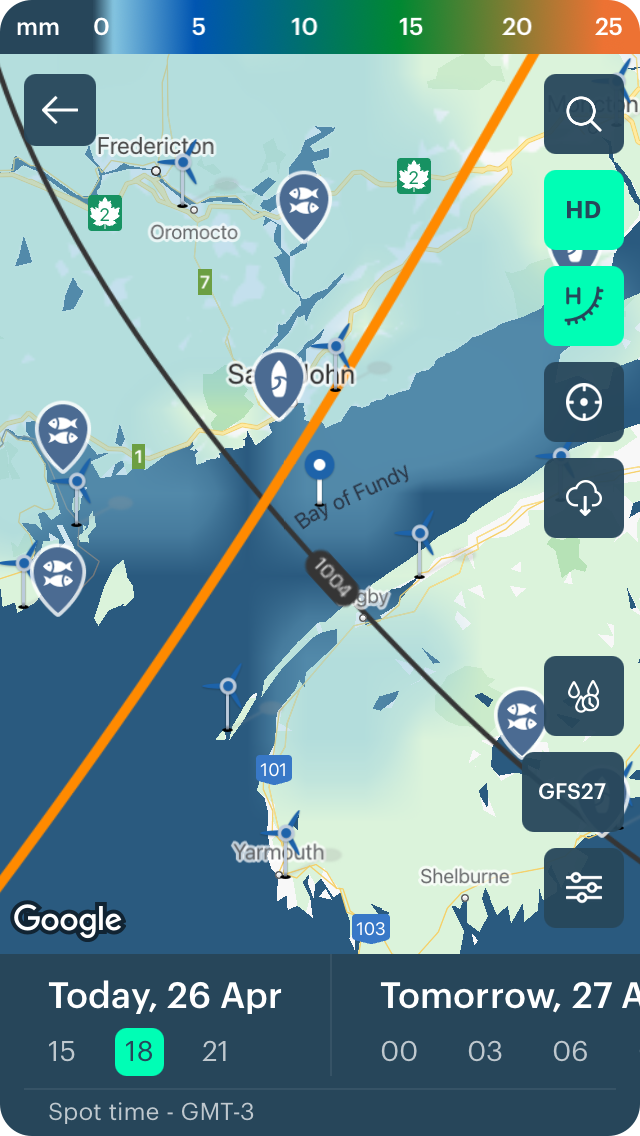
2. Open a spot. Select one of the weather profiles related to water sports. For example, “Fish Pro”, “Surf” or “Sail” (but not “Kite” or “Windsurf”).
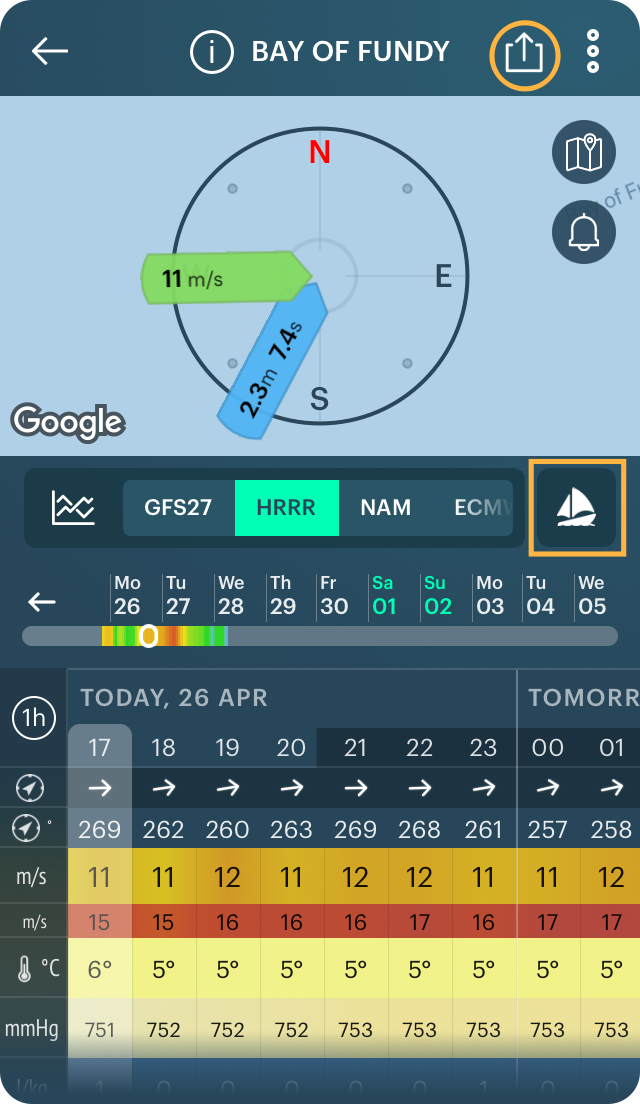
3. Choose a weather forecast model that displays the tide table and tide graph, but also the times of moonrise and moonset. This is shown by the following models: HRRR for the US (on the screen above), GFS27, WRF8, ECMWF, ICON7, ICON13, O-WRF (except EC-ENS).
4. Select the date you want to get the forecast for: today, tomorrow, or any day in the next 3—10 days forecast depending on the model. If you want, change the forecast step: 1 hour or 3 hours on the left side of the screen, where 1h or 3h will be in a circle.
5. The tide forecast is displayed after the water and air forecasts, in a graph that looks like a sinusoid:
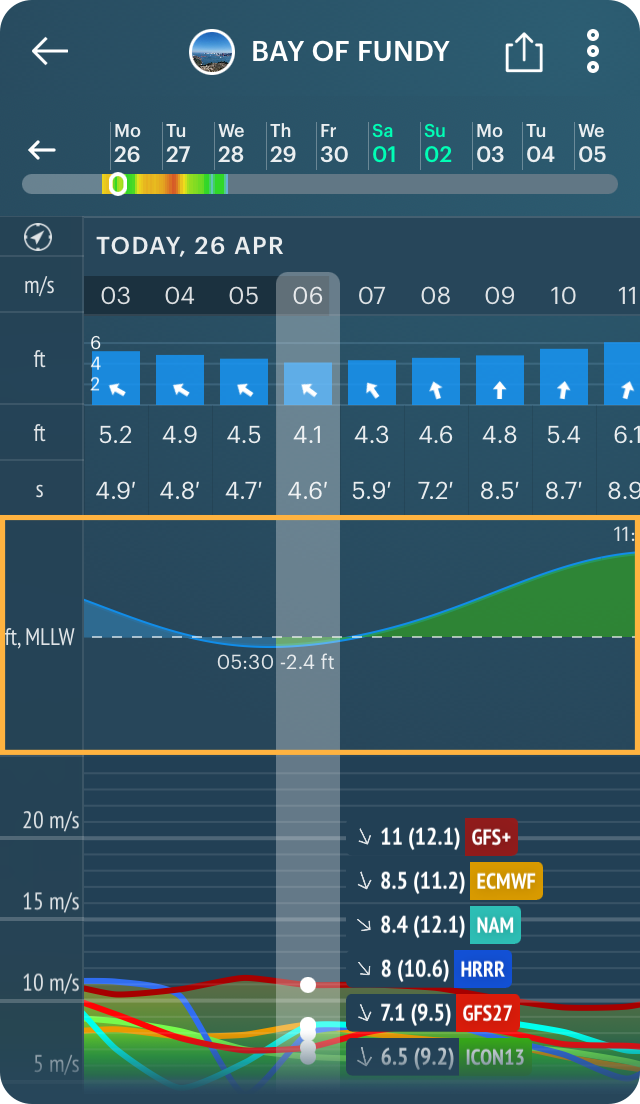
Important: green color shows the period of increasing water level from "low" to "high" tides, and blue, on the contrary, the period of decreasing water level from "high" to "low" tides.
The exact local time and height of the water level are marked on the graph at the extreme points of the maximum and minimum.
You can roughly calculate the water level between extreme points yourself.
6. By moving the screen along the timeline to the right or left, you will see what phase of the tide will be at that time. Now we have here the same data as in the tide table before in this article:
April 26

April 27

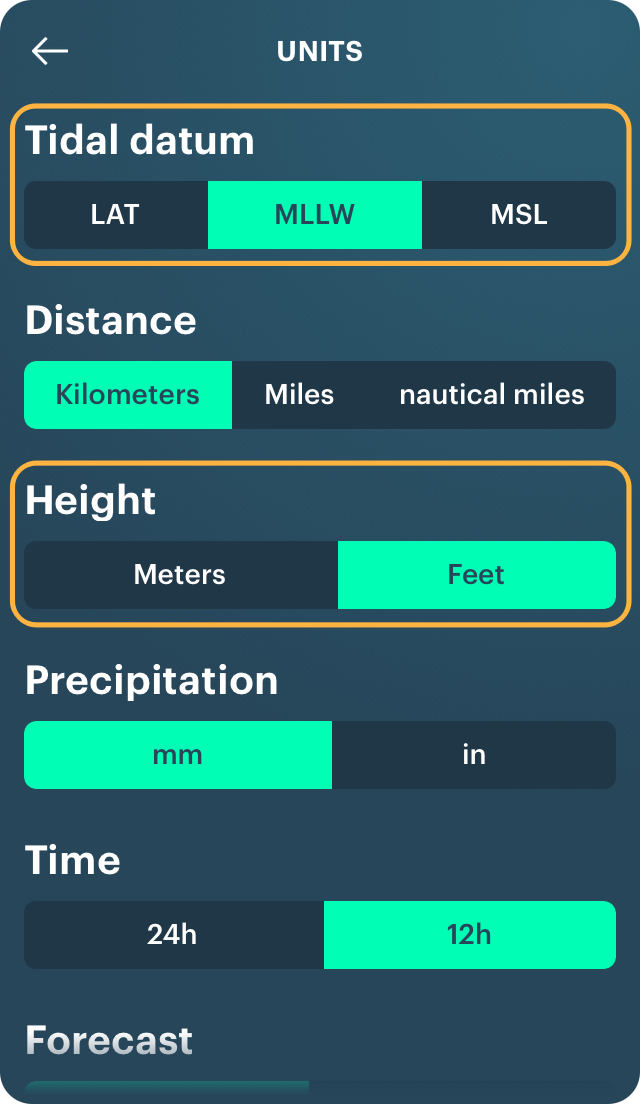
7. In Windy.app you can also change the tidal datum if you want to use the LAT instead of the MLLW or another MSL datum. You can also change feet to meters. To do so, tap on the same weather profile icon and choose Units. Read more about selecting measurement units in Windy.app.

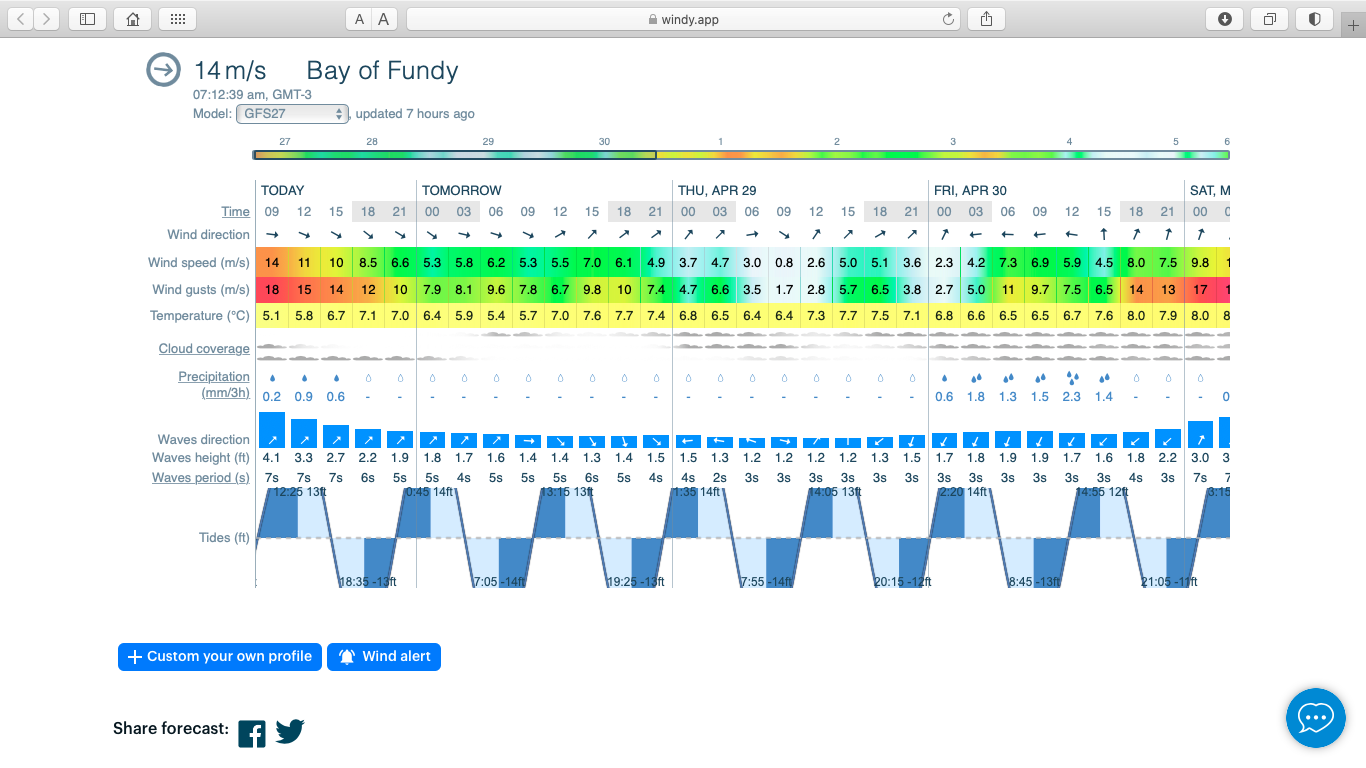
8. You can also find the same tides table on Windy.app website:
One more advice
Also, when planning your outdoor activity, take into account not only the forecast of tides but also the features of the terrain and the height difference. If the coast is flat without a big height difference, then the water level during high tide is likely to rise very strongly and the safe route will be quite far from the coastline at low tide.
How far inland it goes can be checked on the spot: try to find areas of a wet beach (where there was obviously water a few hours ago) or debris that the wave carried ashore.
If the coast is steep, with a large height difference, then even if you stop not very far from the coast, you are unlikely to be covered by water at high tide. Try to be sure the place you plan to be at or pass is well above the tide line.
Text: Natalia Kirasheva, an author from Moscow, Russia, and Ivan Kuznetsov, an outdoor writer from the Dolomites, Italy, and Karelia, Finland. His favorite sports are cycling, hiking and sauna. Read his other articles.
Cover photo: Dave-chambers / Unsplash
You will also find useful
Mini guide to sailing and yachting with Windy.app
Mini guide to fishing with Windy.app
How to read a weather map like an expert. Wind, precipitation, fronts, and more
Latest News
Professional Weather App
Get a detailed online 10 day weather forecast, live worldwide wind map and local weather reports from the most accurate weather models.
Compare spot conditions, ask locals in the app chat, discover meteo lessons, and share your experience in our Windy.app Community.
Be sure with Windy.app.


