
How to compare weather forecasts. Yes, they can be different
You've probably noticed that there is not one, but many weather forecasts sources. They are called "weather forecast models". And that the weather forecasts are different in one or the other model. What can you do? You can compare weather. And this article will help with this.
What is a weather forecast model?
Forecasting requires a vast array of meteorological data, collected by satellites, observation systems, weather stations, aircraft, ships, weather balloons, radars and so on.
A weather model is a mathematical model, a combination of various weather factors and variables, which works with this data to create accurate weather forecasts.
Why are there so many models and different weather forecasts?
Weather models are very complex, so they are calculated on powerful supercomputers. They solve insanely difficult mathematical equations. Those equations can be drastically different depending on the region, its terrain, man-made objects, and many other factors.
In other words, the Earth is big, its atmosphere is very unstable and chaotic, and it is hard to predict the weather. So there is no single system or model for the whole world, but many of them.
Usually, weather models are provided by national weather services, but sometimes they can also be produced by groups of enthusiasts.
There are two main types of forecast models: global ones, covering the entire planet, and local ones, covering specific areas, such as continents, countries, regions, and so on.
Both global and local models also vary in their grids (or resolutions), depth, steps, and update frequency. Learn more about weather forecast models.

Photo: boxed-water-is-better / unsplash
Why compare weather forecasts from the different models?
You need to compare forecast from the different sources in order to read it correctly to get a more accurate data for the spot you are interested in.
For example, even a slight difference in the forecast wind speed can affect the choice of equipment.
Imagine, forecasts based on different models show that wind speeds will be 10 m/s, 16 m/s, and 14 m/s. If you compare all three forecasts, you will be guided that the wind at the spot will blow at about 14 m/s. From my personal experience of kitesurfing and paragliding, this is a significant difference. It’s very dangerous to use a large kite (suitable for 10 m/s) in winds of 14 or more m/s — you can lose control and get serious injuries.
Or, for example, if according to one forecast on your hike route, the probability of precipitation is 10%, and in others — 35% or 50%, just in case you take more waterproof and spare things. But if you rely only on the first forecast, you risk getting wet and left without a change of clothes.
So the weather forecast model comparison is very important, when we speak about better weather forecasting.

Photo: diego-banchero / unsplash
What weather can I compare in Windy.app?
You can compare weather parameters from the different weather models on the spots and on the world map for the different days, months, years, and even the seasons (climate comparison).
Here is an exact list of parameters:
- Wind speed
- Wind gusts
- Wind direction
- Precipitation (snow and rain)
- Temperature
- Atmospheric pressure
(In total, there are more than 50 different weather parameters, data, indexes, icons and charts you can get in Windy.app for iOS and Android. And we add the new ones all the time.)
More: you can compare the weather models themselves based on data from weather stations (weather station comparison), the main tool used to collect weather information all over the world. By the way, Windy.app has almost all of the world's weather stations.
How to compare weather in Windy.app?
The app has several ways to compare weather at once, the first three of which are key ways:
Compare mode
There is a special weather comparison tool in Windy.app called "Compare Mode". It works like this: you just press one button and everything compares itself and builds a graph. The feature is available in the Pro version. It is located to the right of the weather models.
So, with this function, you can compare wind speed, gust, and direction on a single graph:
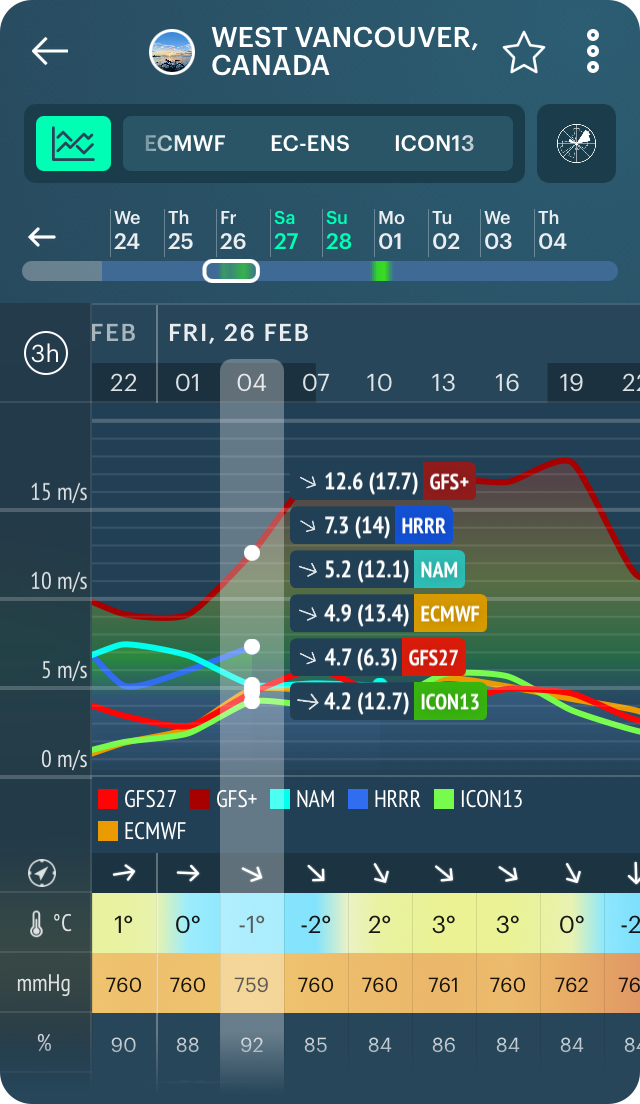
Compare Mode in the Windy.app for iOS
Forecasts for different models are drawn in different colors. In total, 10 models are available for comparison in the app, but some of them are regional, so they don't work for all spots: GFS27, WRF8, GFS+, O-WRF, ICON13, ECMWF, ICON7, AROME, NAM, HRRR.
Each model name has the wind speed (in the unit of your choice) written next to the name, and arrows indicate the direction of the wind, and parentheses indicate the wind gusts. Both of these values are valid for the time interval that is highlighted in the light gray column.
You can also compare wind direction and wind gusts separately. To do so, go to Weather profile to the right of the weather models and choose Wind gusts compare chart:

Compare charts in the Windy.app for iOS
Compare Mode gives you the power to quickly assess current wind forecast trustworthiness. To put it simply:
- If the lines are close together, it’s most likely that the wind speed would be between the highest and the lowest forecasted values.
- If the lines are far apart, the chances of the forecast failing are higher and it’s better to choose a different time or a different spot if the stakes are high.
If wind direction is a concern for you, be sure to select a certain hour to view the range of possible directions. Keep in mind that if the wind direction forecasted by available weather models differs by more than 30 degrees, it must be viewed with caution.
It's also possible to make weather forecast accuracy comparison for rain, snow, and other types of precipitation using the same weather models. These parameters are also shown as graphs and in the units of your choice:

Precipitation compare in the Windy.app for iOS
If Compare chart shows that the forecast isn’t trustworthy, here’s what we recommend:
- Use the spot’s chat to talk to other users and ask which model works better for this spot.
- Check out weather stations nearby to see which model is closer to reality.
- Be prepared for unexpected weather or choose a spot with a more reliable forecast.
Ensembles
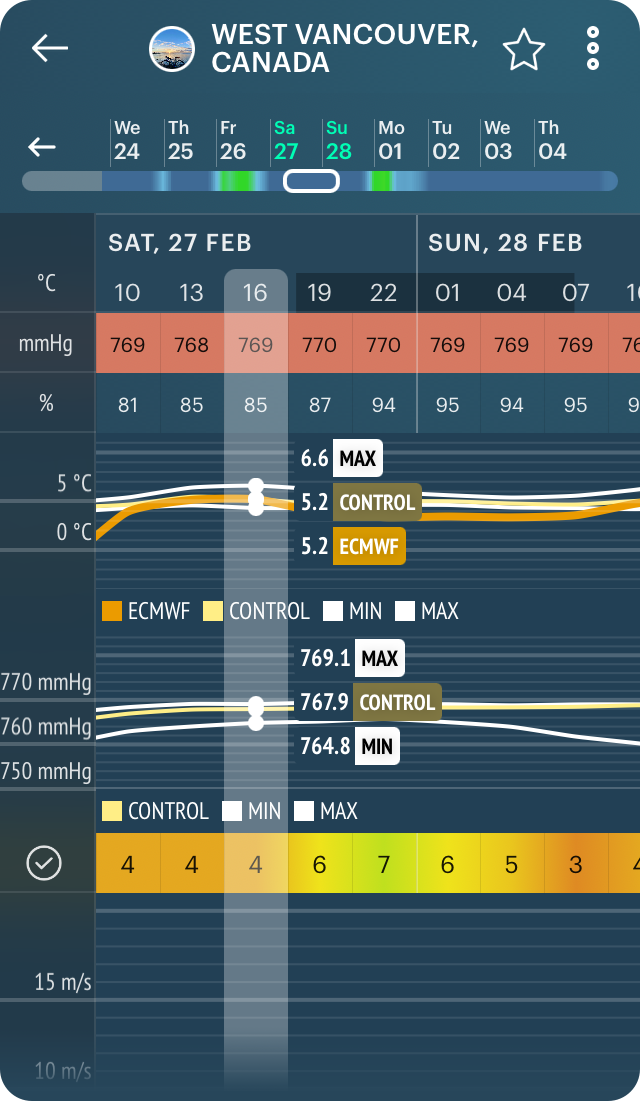
Compare temperatures, as well as compare average temperatures, and atmospheric pressure cannot be made in the Compare Mode function, but it is possibly with the EC-ENS model (now iOS only, Android soon).
EC-ENS model (or Ensemble model) is indispensable if you need the most accurate forecast for more than three days in advance. It gives a forecast in min, max and average value. Learn more about this model in this article.
To activate it, go to the same Weather profiles and choose Expert profile and ECMWF model:
Weather models rating and Top-rated weather forecast model
There is a Weather Models Rating feature in Windy.app, which is based on the data from weather stations. In other words — forecast accuracy. There are three models. You see the data in percentage for each of them. The percentage indicates how accurate the model is. The higher the percentage, the more accurate the forecast from the weather model on this particular station.
You can find three nearest weather stations on each spot screen:

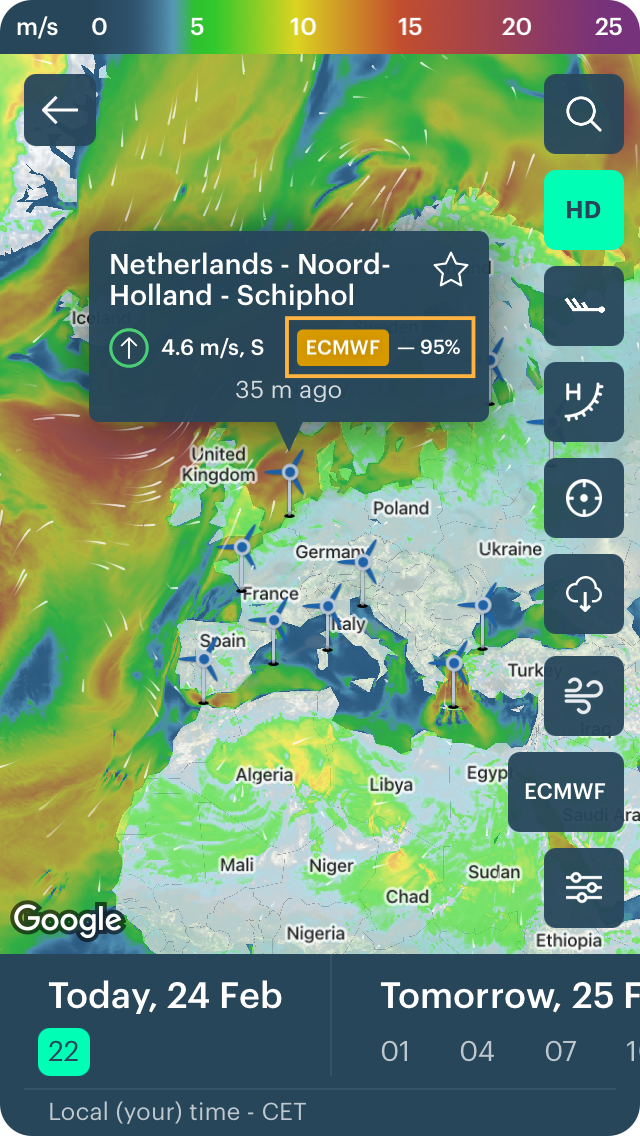
Then, the most accurate of the three models can be seen at each weather station on the Wind and Precipitation Map.
Just click on the station and see the most accurate model in the station’s window:
Important: the comparison is made for the last 10 days.
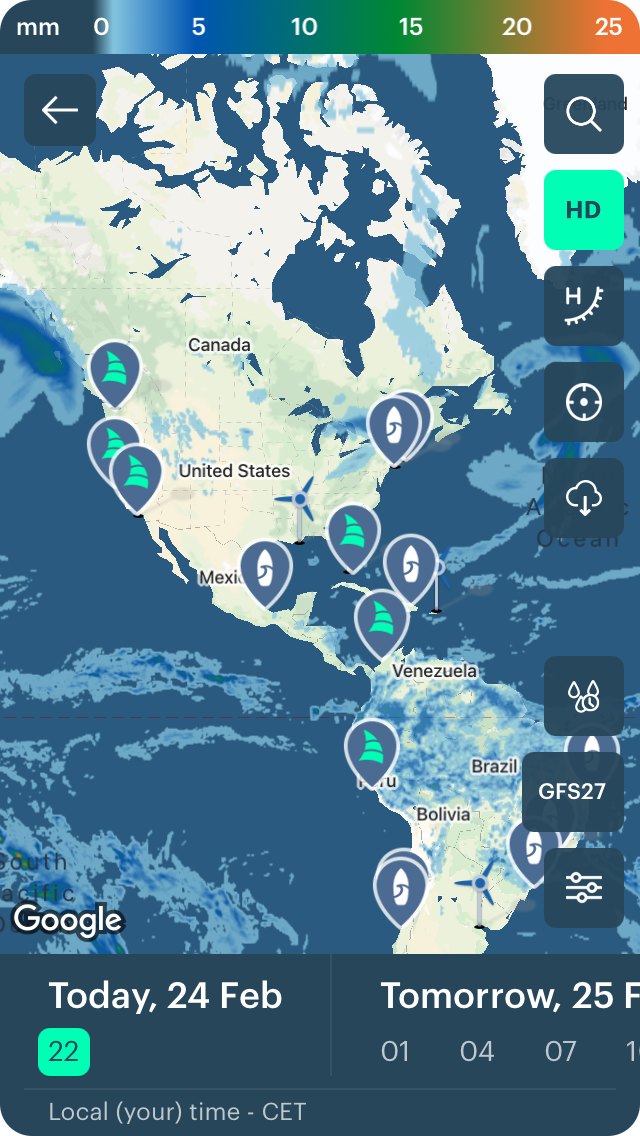
Wind and Precipitation map
You can compare wind speed, gusts, and direction or make rainfall comparison in different regions on the Wind and Precipitation Map of the world — another great Windy.app feature. This is a live interactive and very visual map that makes it easy to make weather comparison between countries, too:
Weather history
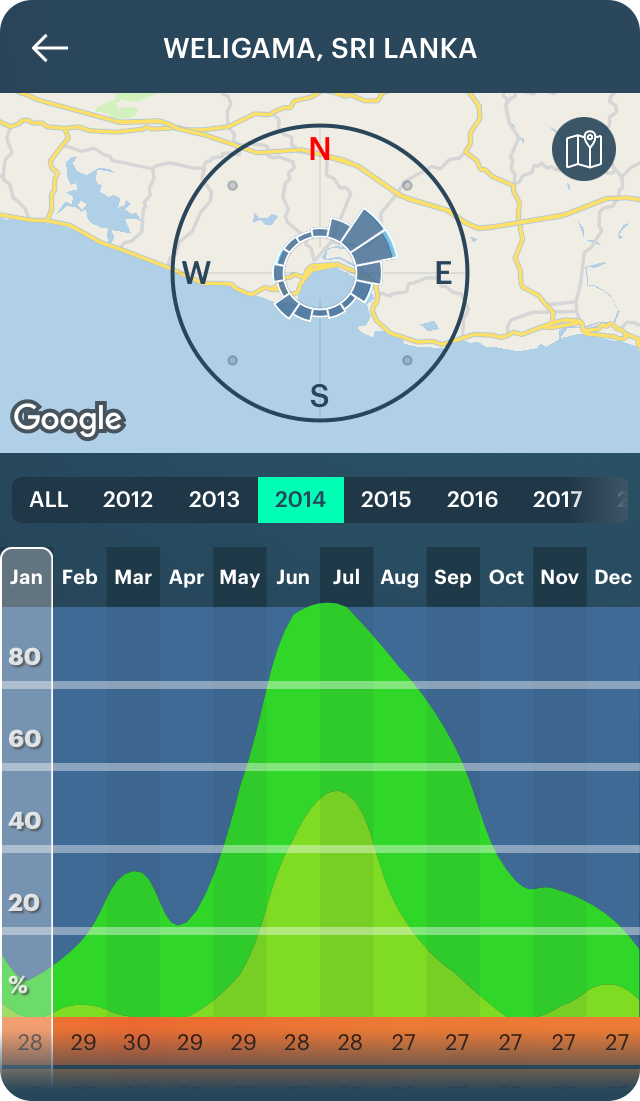
In Windy.app there is a feature called Weather Archive, as well as a Detailed Weather Archive. This is accurate statistics on wind, temperature, and some other weather parameters since 2012 — for the last 9 years. That's how you can make weather comparison by year in the application. You can see it in the chart and on the wind rose by month and day during each year and compare to forecasts.
Weather Archive feauture is also located at each spots screen:
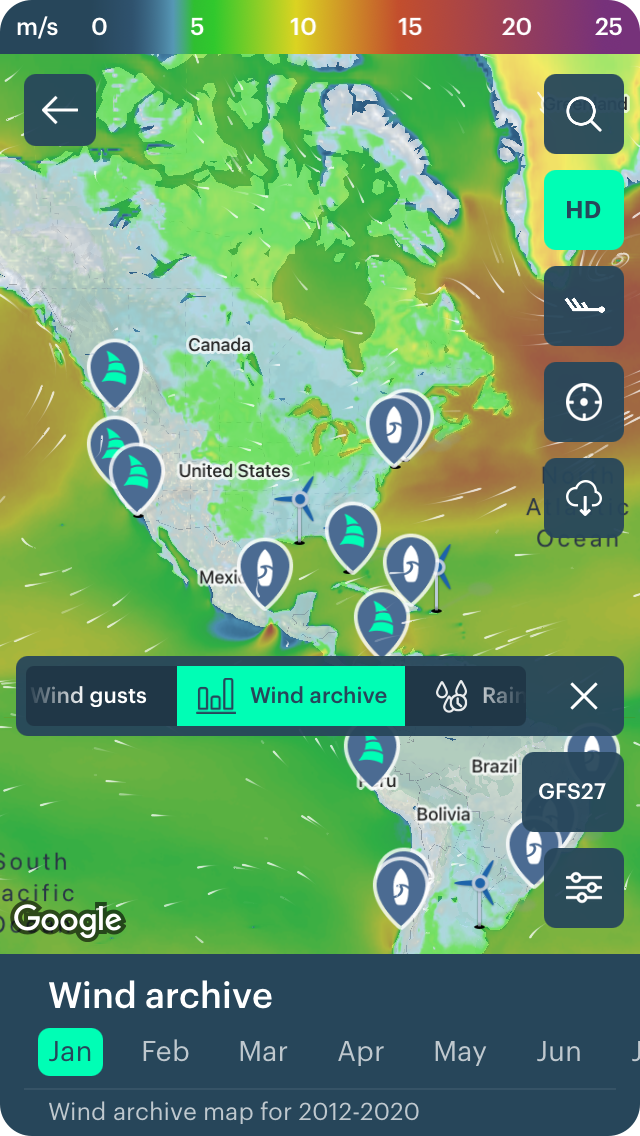
You can also get this data on the Wind and Precipitation Map. The data is presented in a slightly different way. The map shows the calculated average wind speed for each month for the same 9 years from 2012 to 2020. You get the data without calculations and in a more clear way:
Learn more about weather history in this article.
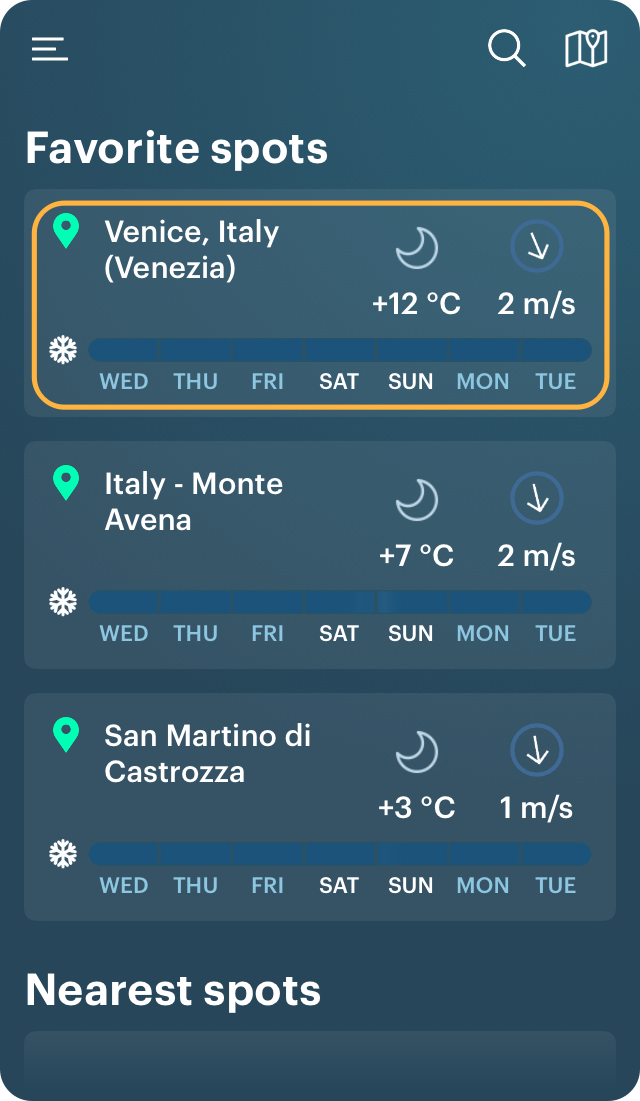
Weather widgets for your Favorite spots
Finally, if you choose your favorite spots in the app, you can see and compare wind speed, temperature, atmospheric pressure, and snow precipitation data right on the Home screen of the app. To do so, activate the Weather widget feature.
Last, but not least: many spots in Windy.app are not only outdoor spots, so you can make weather comparison between cities:
Text: Natalia Kirasheva and Ivan Kuznetsov, an outdoor writer from the Dolomites, Italy, and Karelia, Finland. His favorite sports are cycling, hiking and sauna. Read his other articles.
Cover photo: paul-green / unsplash
You will also find useful
How to set up a weather widget for a spot
There is new British weather supercomputer
Latest News
Professional Weather App
Get a detailed online 10 day weather forecast, live worldwide wind map and local weather reports from the most accurate weather models.
Compare spot conditions, ask locals in the app chat, discover meteo lessons, and share your experience in our Windy.app Community.
Be sure with Windy.app.


