
What is total accumulated precipitation and why is it different
In addition to the precipitation forecast you already know, sometimes it is useful to check accumulated precipitation for various sports. In this article, we'll explain what cumulative precipitation is, how it differs from normal precipitation, and how to read the accumulated precipitation map.
What is accumulated precipitation?
Precipitation is moisture in the atmosphere that falls to the ground in the form of rain, snow, or hail. (In case you missed our lesson in the Meteorological Textbook on what precipitation is, read it on the website.)
Depending on the weather model, like ECMWF for example, the precipitation forecast is made every three hours for today, tomorrow, the day after, and the next 10 days. Sometimes you may see longer weather forecasts, but they are less accurate.
Accumulated precipitation is the sum of precipitation over a certain period of time in a certain place. Or: how much rain has fallen or will fall in total. Yes, you can check cumulative precipitation not only as a forecast for the future but also as a statistic of past weather data or weather history.

Photo: M-h / Unsplash
Why do you need to know about accumulated precipitation
Knowing the accumulated precipitation can be useful in many cases for various sports and outdoor activities:
- For example, it may be necessary for those who are going to hike, let's say, in the canyons of Zion National Park in the United States, in order to know how much the rivers are flooded after the rain and whether it will be possible to cross them. Usually, the heavier and longer the rainfall, the more flooded the rivers become. Crossing even a small and weak river can be dangerous, you can easily be carried away by the current.
- Or, for example, heavy rainfall in general always indicates that some area has become very wet — land, forest, rocks, roads — it can be problematic to move around in this area. If you're hiking or biking, you may also want to change your route or go around that area to avoid discomfort or difficulty while doing various sports and outdoor activities.
Perhaps for certain sports or types of travel, heavy rainfall can also be an advantage. Let's say there was a severe drought somewhere, but you see that it's going to rain a lot in the next few days. So it is good for you.
So, the accumulated precipitation gives a general idea of precipitation in a particular region for a period of time up to 10 days in the future or in the part.
How to read an accumulated precipitation map?
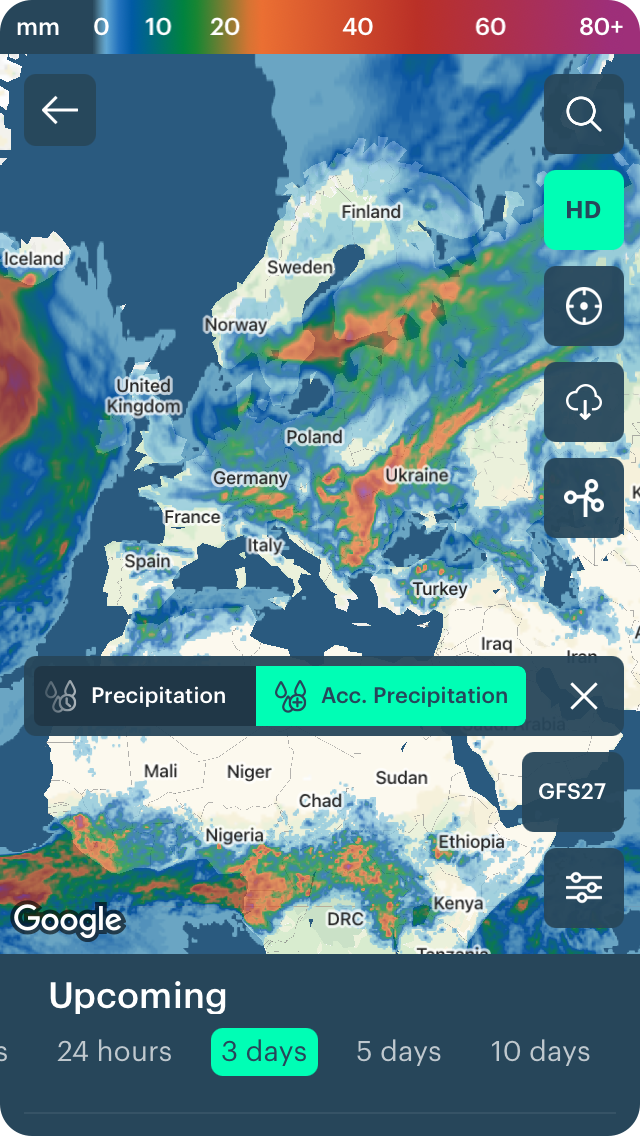
It is more convenient to get a forecast of accumulated precipitation in the form of a weather map. Let's take Windy.app as an example:

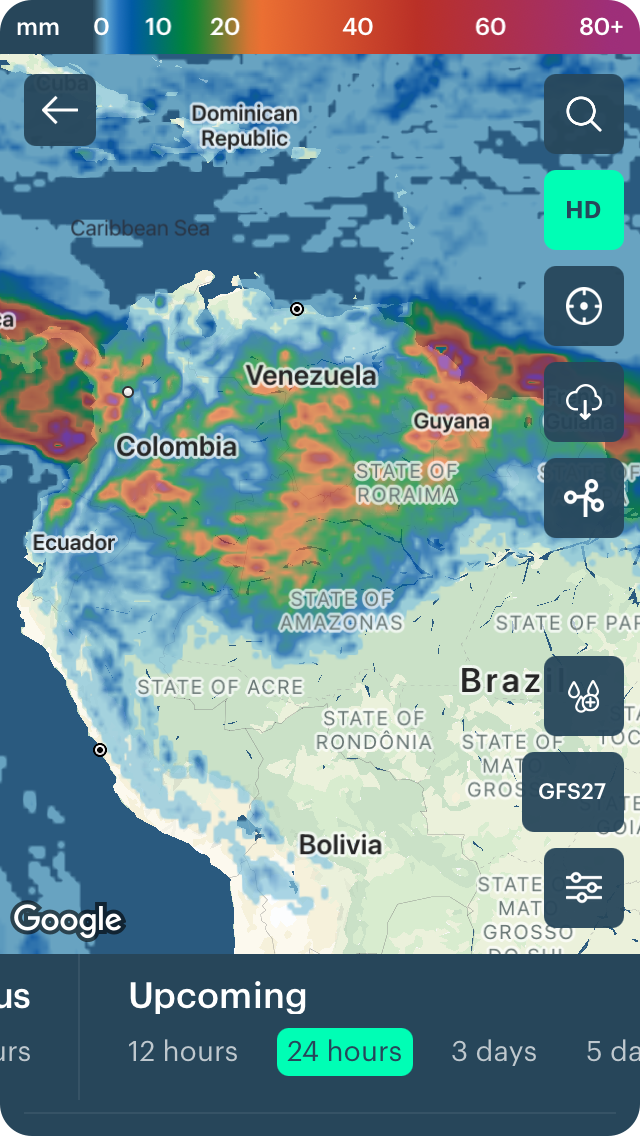
- Here you see a simple color scale from blue and green (little precipitation) to red and magenta (a lot of precipitation).
- Precipitation is measured in millimeters, but you can change the unit to inches for the U.S. and other regions where the imperial system is adopted.
- Zoom in and out of the map to find a particular region you are going to.
- At the bottom of the screen on the timeline, you have the following time intervals: 12 hours, 24 hours, three days, five days, 10 days. This way, you can find out how much precipitation has fallen or will fall in a certain place during these periods.
For example, at the time of publication of this article, we see that in the next 12 hours, the rainiest place in Europe will be the Swedish capital of Stockholm. During this time, about 30 mm of rain will fall there.

Next, let's take 24 hours of accumulated precipitation for South America. There will be almost no rain on the whole continent, except in parts of Colombia, Venezuela, and Guyana — there will be quite heavy rains with accumulated precipitation of 20–30 mm.
Over the next three days, the most rain and other precipitation will occur in the Midwest in the United States in cities such as St. Louis, Oklahoma City, Kansas City, and others. The amount of precipitation is about the same — 30–40 millimeters.

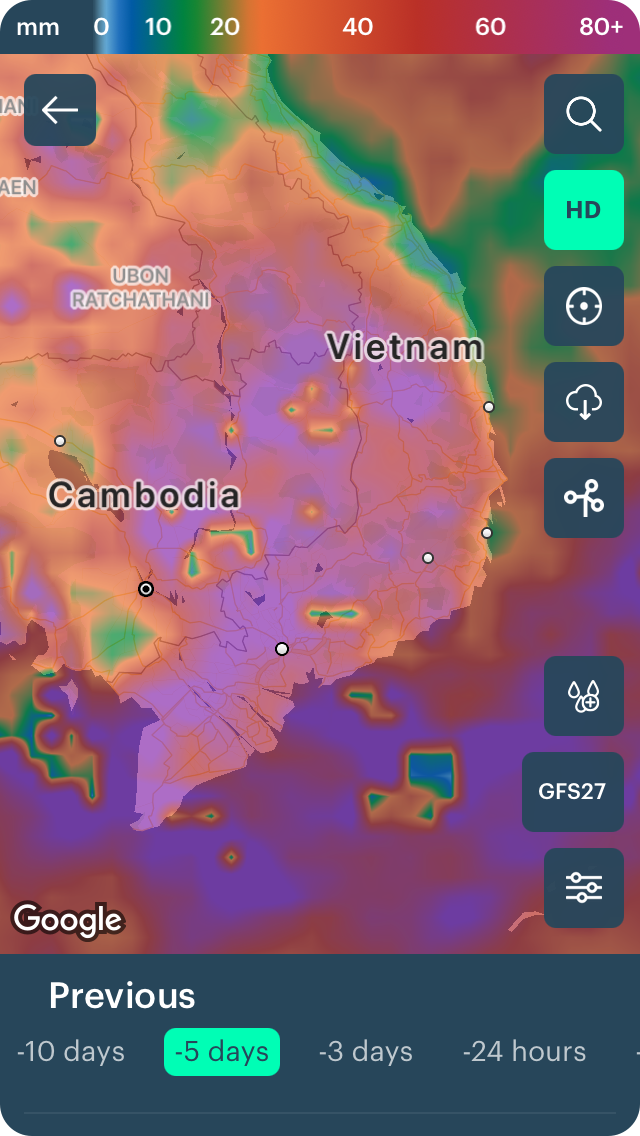
Now going back in time. The region of Southeast Asia, in particular Vietnam, for example, including its capital Hanoi, has had the most rainfall in the last 5 days with total accumulated precipitation of maximum 70–80 mm, and even more.
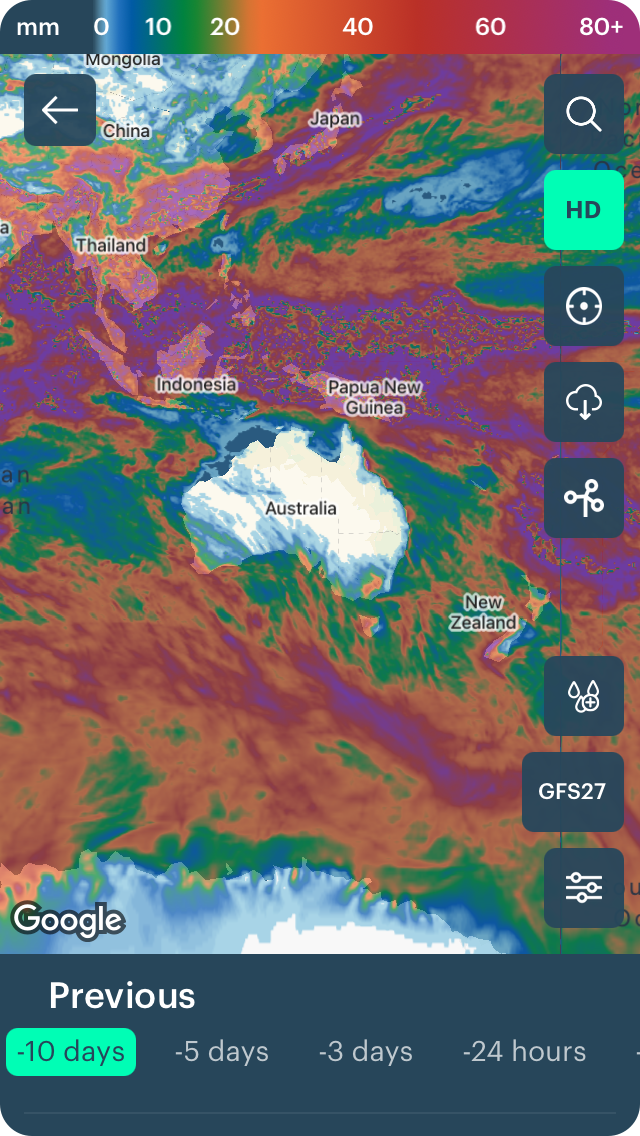
Or vice versa: over the past 10 days, heavy rainfall almost bypassed the entire continent of Australia, including its main cities of Sydney, Melbourne, Brisbane, Adelaide, and others. There was almost zero mm of cumulative precipitation.
(By the way, by clicking on the names of cities you can get the weather forecast for them directly on this site, as well as in the app.)
Where to find total accumulated precipitation in Windy.app?
As with many other useful features, you can find accumulated precipitation in the app in less than three clicks:
1. Click on the Weather Map on the app's Home screen or on the map icon on each spot screen.
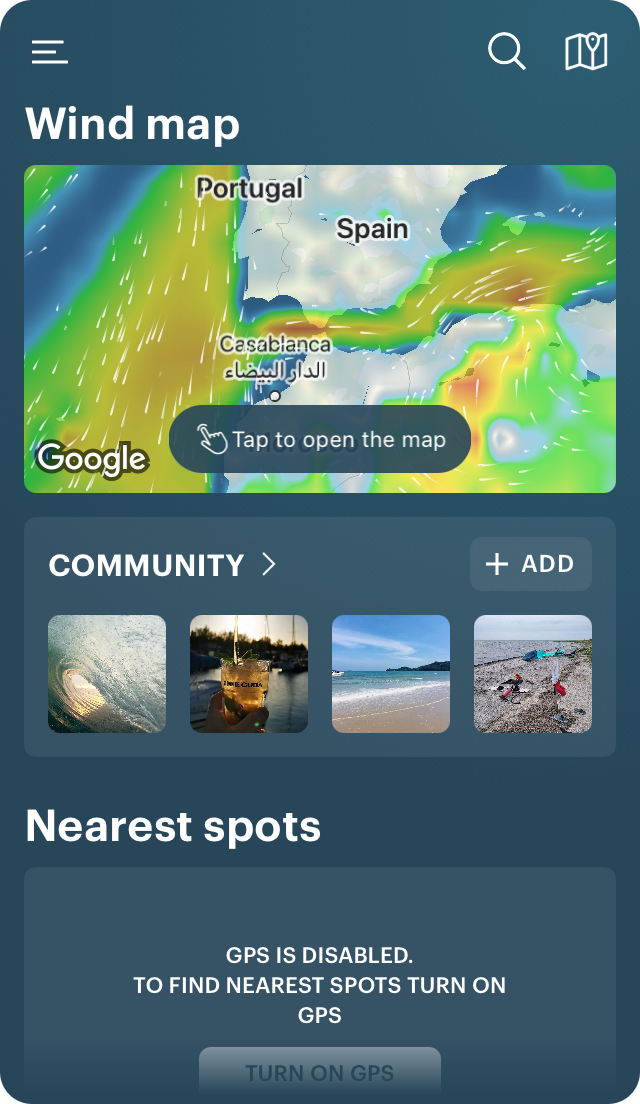
2. Open the accumulated precipitation layer in the menu.
3. Move the timeline to the past or future to see the amount of precipitation in particular the region.
Text: Ivan Kuznetsov, an outdoor journalist, editor and writer from the Dolomites, Italy, and Karelia, Finland, with eight years of professional experience. Read his other articles.
Cover photo: Florian-schmetz / Unsplash
You will also find useful
Guide to Weather Map in Windy.app
How to read a weather map like an expert. Wind, precipitation, fronts, and more
How to read contour lines on weather maps. A brief manual
What are the precipitation measurement instruments and how they work
Latest News
Professional Weather App
Get a detailed online 10 day weather forecast, live worldwide wind map and local weather reports from the most accurate weather models.
Compare spot conditions, ask locals in the app chat, discover meteo lessons, and share your experience in our Windy.app Community.
Be sure with Windy.app.


