
How to read a wind map like an expert
A wind map is one of the types of weather map, which in turn is one of the two most popular forms of weather forecasts, along with its presentation as a standard table. In this article, you will learn more about what a wind map is and how to read it like an expert.
What is a wind map?
The wind map is one of the three most common types of weather map that shows what wind is blowing around the world (two other maps / weather elements are air temperature and precipitation).
A modern wind map is a digital interactive (live) map you can get on some website or rather in a weather application for your smartphone and tablet.
With the development of digital technology, it is also has become possible to separate the wind map from the other weather elements, as well as to create separate maps for many of them. Previously, on paper maps, the elements were combined on one general weather map that included wind, precipitation, temperature, cloud cover, and more.
The data you see on a typical wind map is a forecast for today and, most often, the next 3–10 days from one of the several weather models, which, in turn, could be of one of the two main types: global with a forecast for the whole word and regional or local with a forecast for only some part of the world. For example, it could be a wind map for North America, Mediterranean Sea cost and the like.
Accordingly, a wind map is needed to get the appropriate forecast in a visual form that the usual forecast table, graph, and other forms of presentation do not provide. It is also a way to get a bigger weather picture.
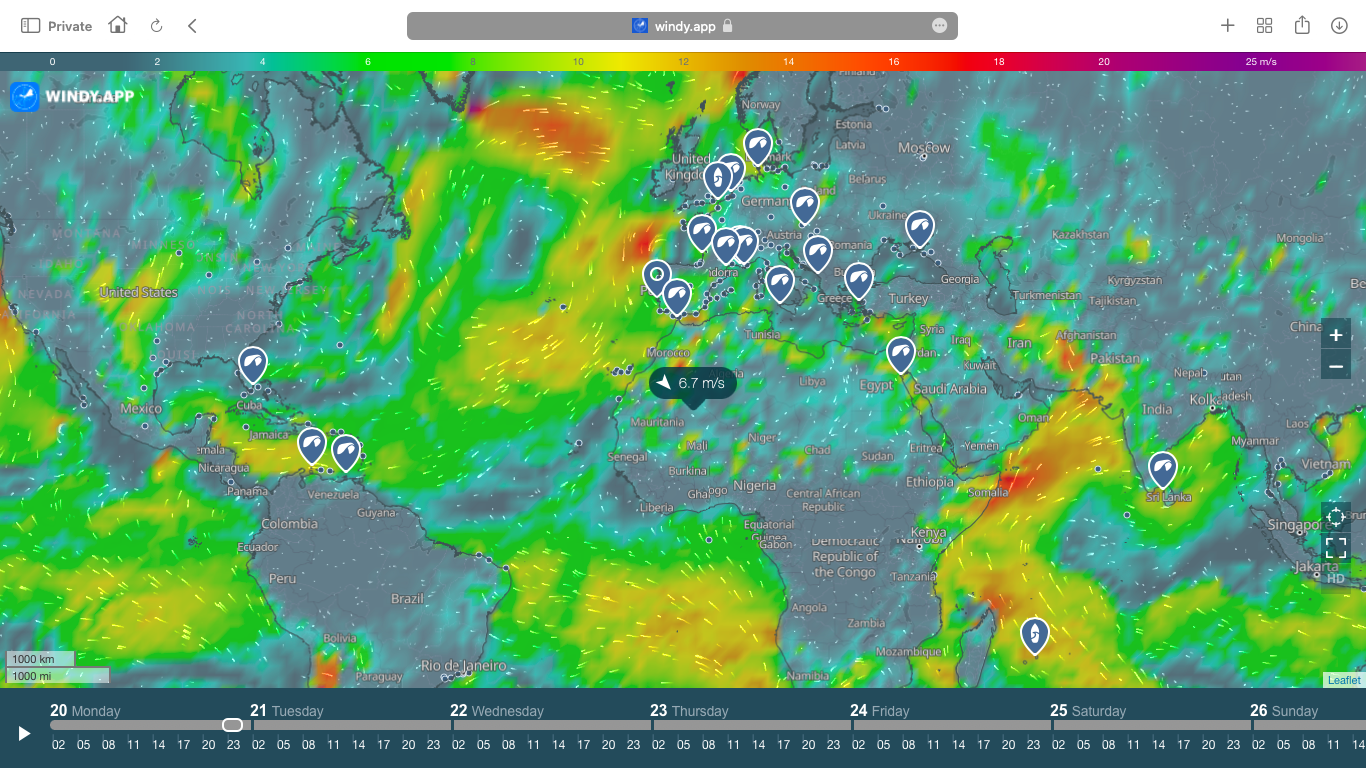
Live Wind Map on the Windy.app site
How to read a wind map like an expert?
To read any type of weather map correctly, you need to know that there is no single weather map, there are many, and they look different with different information and visualization depending on the source.
However, the weather map generally consists of the following basic elements, so keep your attention on them, while reading the map:
- colors,
- special symbols,
- numbers,
- letters or phrases,
- lines,
- different interactive elements.
So, let's figure out how to read a wind map using the Windy.app as an example in 10 steps:
1. There are two wind maps you can get: in the app and on this website. The maps are more or less the same but the wind map in the app has more features. About the main ones, you will learn right below. However, the main feature of the map on the site is that you can get the wind forecast without a single click literally by moving the mouse (finger) on the map.
2. On the wind map in the Windy.app you see small white dots that look like waves — this is an example of an interactive element that you can use to roughly understand the wind direction, i.e. where the wind is blowing from. Yes, FROM (not to where) is the direction of the wind. So this is how is wind direction indicated on a wind map.
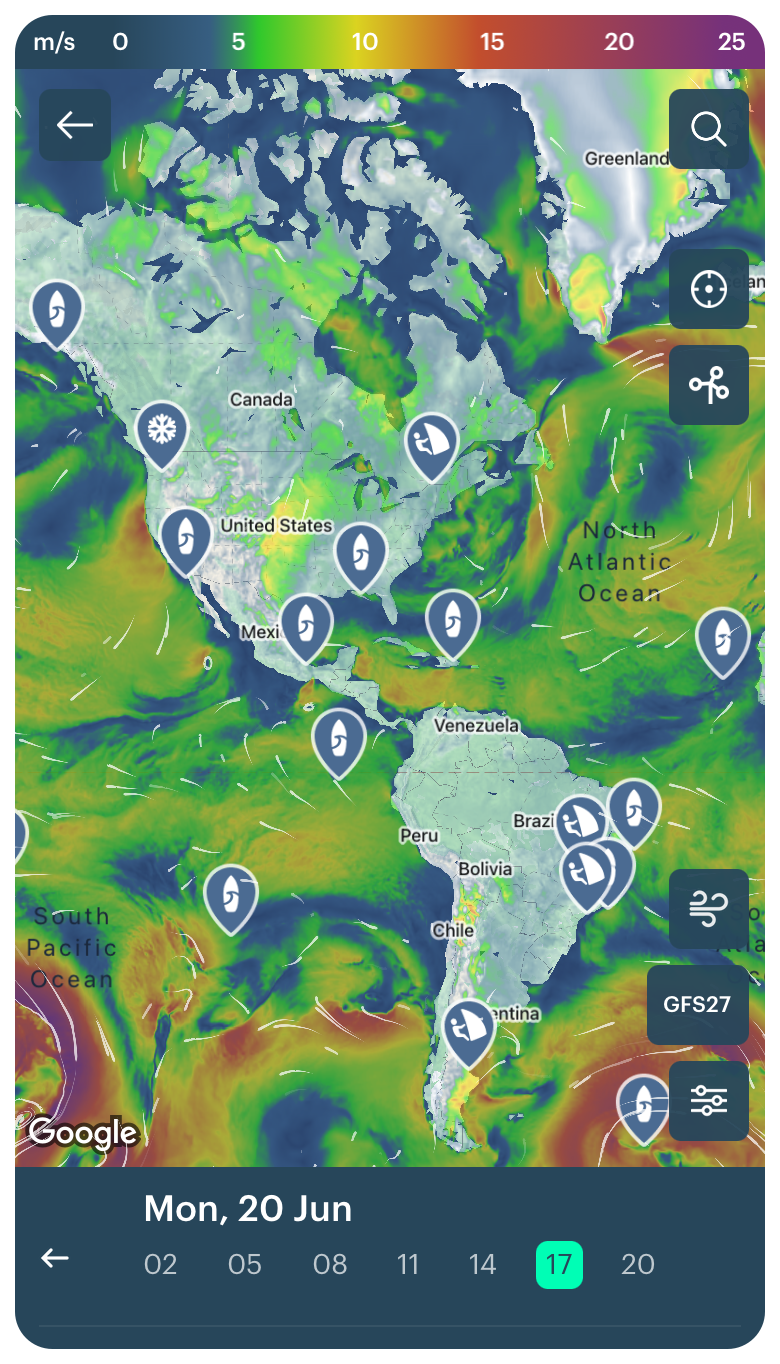
Live wind map in the Windy.app for iOS
3. To understand exactly where the wind is blowing at a particular point on the map, click on an individual outdoor spot or any place on the map. You will see a screen with wind direction and speed.
4. The map is colored in different colors — from blue (no wind) to purple (hurricane wind). The colors show you wind speed or gusts (short-term wind increase up to 20–30 seconds). To see the speed or gusts, switch the map layer in the Settings to "Wind" and "Gusts", respectively. In the Windy.app you can also change these colors to any other colors of your choice.
5. To find out what the wind will be in a particular region or spot, zoom in and zoom out the map.
6. Remember about weather models? You can change them too. Just tap on a weather models slider to get a wind forecast from one of the global or regional models.
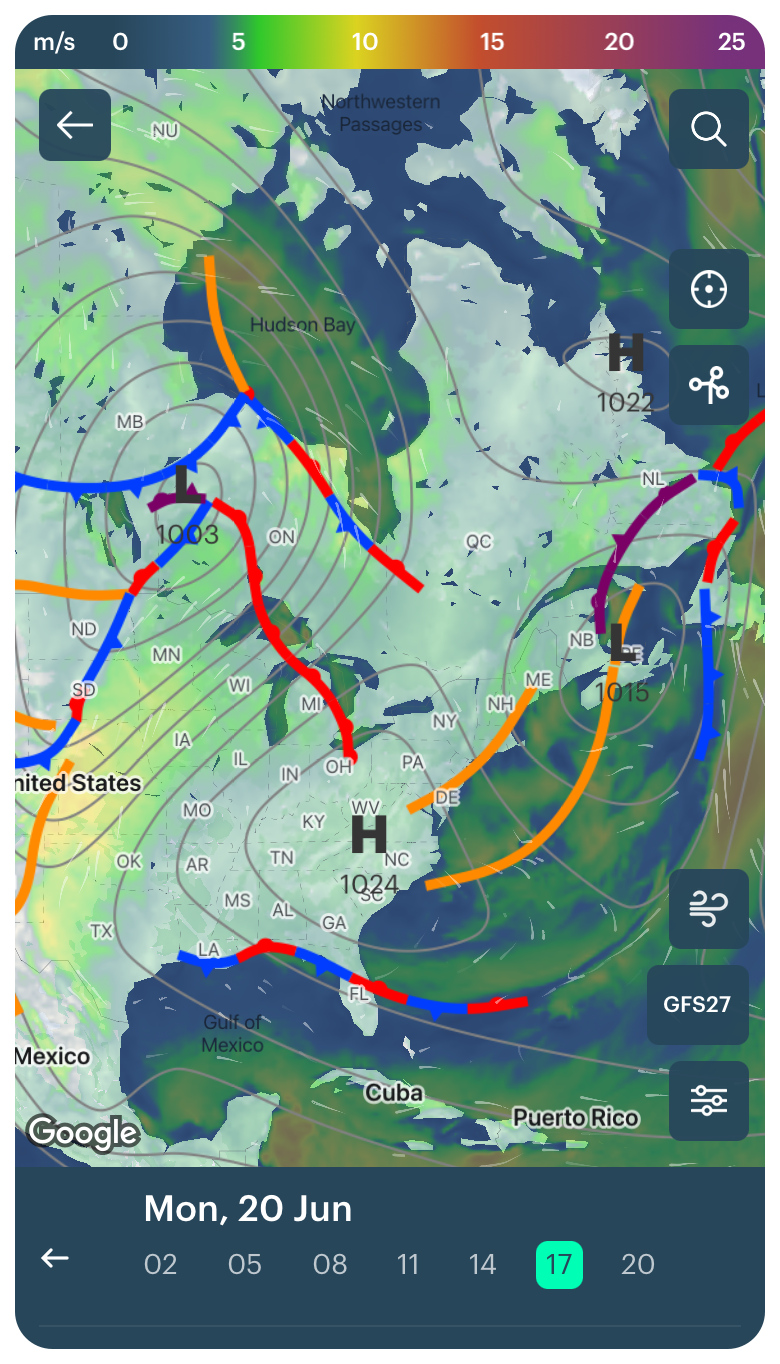
Atmospheric fronts and isobars map on the live wind map in the Windy.app for iOS
7. If you have used paper weather maps, you already know what wind barbs are. If not, try them for the first time. These are symbols that are used to indicate wind speed and direction. For many, for example, sailors, they are still a handy way to get a forecast that has been transferred to interactive maps.
8. Another way to get a wind profile on a map is to activate isobars, lines that show areas with the same atmospheric pressure. For example, lines closer together accurately mean stronger winds than more distant lines.
9. On this same wind map you can see not only the forecast but also the actual winds in real-time thanks to data from more than 30,000 weather stations around the world.
10. Finally, the wind map also has an Archive or wind history layer. This is the average wind value by month. By choosing it, you can see where the wind is blowing more and faster during the year. It is a very useful feature that you probably won't find in other applications.
Where to get a wind map in the Windy.app?
The live wind map in the Windy.app is a general weather map layer. To use it, go to the appropriate section from the Home screen or from any spot screen and activate the wind speed or wind gusts map, or any other function described above.
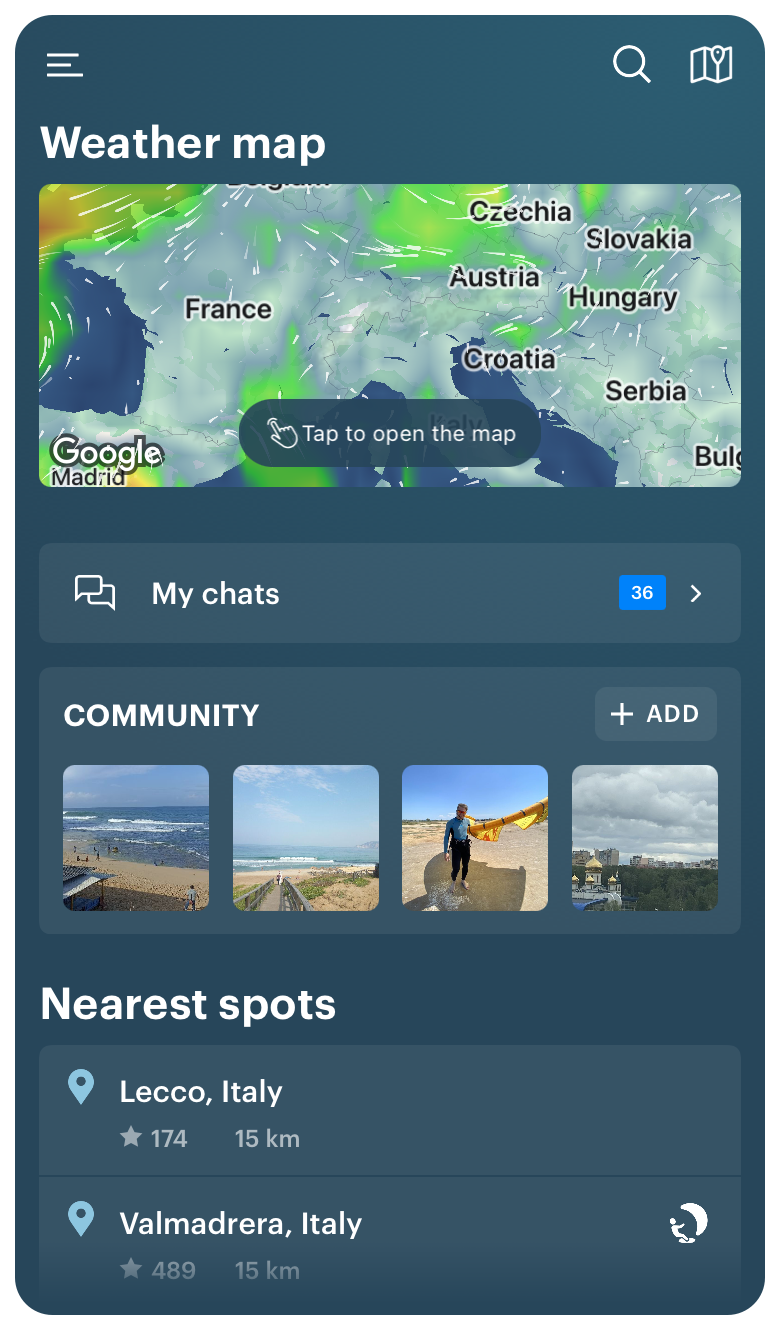
Live wind map on the Home screen in the Windy.app for iOS
On the Windy.app site, the wind map is a separate map in the appropriate section you can find on the following URL: https://windy.app/map.
If any of the above remains unclear to you, read the separate, more detailed guides to the wind map in the app and on the website.
Text: Ivan Kuznetsov
Cover photo: Mael Balland / Unsplash
You will also find useful
Latest News
Professional Weather App
Get a detailed online 10 day weather forecast, live worldwide wind map and local weather reports from the most accurate weather models.
Compare spot conditions, ask locals in the app chat, discover meteo lessons, and share your experience in our Windy.app Community.
Be sure with Windy.app.


