
How to read hurricane map like an expert
A hurricane map is one of the types of weather map, which in turn is one of the two most popular forms of weather forecasts, along with its presentation as a standard table. In this article, you will learn what is hurricane map is and how to read it like an expert.
What is a hurricane map?
A hurricane map is special type of weather map that shows hurricanes — the most destructive type of weather storm in the world. Hurricanes bring strong winds with gusts first, but also heavy precipitation, including thunderstorms and lightning, and other things, resulting in flooding and power outages, and other problems.
Scientifically, in meteorology, hurricanes are called tropical cyclones. It is also important to note that they are called this mainly in North America, in Asia they are called typhoons, but this is the same thing. Hurricanes and typhoons occur almost all year round, but their peak or so-called "hurricane/ typhoon season" is in the summer period.
A modern hurricane map is a digital interactive (live) map you can get on some website or rather in a weather application for your smartphone and tablet.
With the development of digital technology, it is also has become possible to separate the hurricane map from the other weather phenomena, as well as to create separate maps for many of them. Previously, on paper maps, they were combined on one general weather map that included wind, precipitation, temperature, cloud cover, and more.
The data you see on a typical hurricane map is a forecast for today and, most often, the next 3–10 days from one of the several weather models, which, in turn, could be of one of the two main types: global with a forecast for the whole word and regional or local with a forecast for only some part of the world. For example, it could be a wind map for North America, Mediterranean Sea cost and the like.
Accordingly, a hurricane map is needed to get the appropriate forecast in a visual form that the usual forecast table, graph, and other forms of presentation do not provide. It is also a way to get a bigger weather picture.
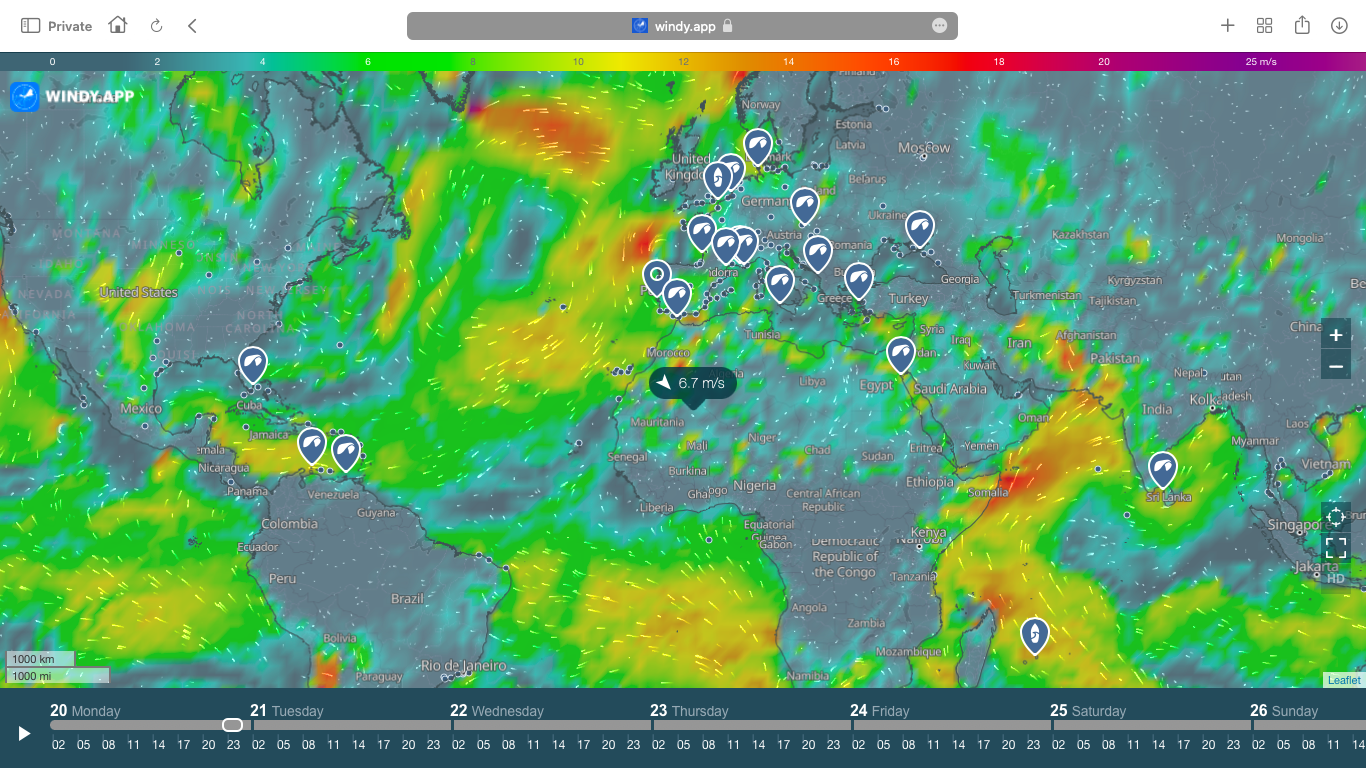
Live wind map on the Windy.app site
How to read a hurricane map like an expert?
To read any type of weather map correctly, you need to know that there is no single weather map, there are many, and they look different with different information and visualization depending on the source.
However, the weather map generally consists of the following basic elements, so keep your attention on them, while reading the map:
- colors,
- special symbols,
- numbers,
- letters or phrases,
- lines,
- different interactive elements.
So, let's figure out how to read hurricane map using the Windy.app as an example in 10 steps:
1. Open the Weather Map from the Home screen or from the Spot screen in the app.

Home screen of the Windy.app for iOS
2. Select the Wind Speed or Wind Gusts layers.

Wind Gusts layer on the Weather Map in the Windy.app for iOS
3. To identify hurricanes on the Wind Map, first pay attention to the wind color scale at the very top of the screen, in which certain colors correspond to specific wind speed and gusts. Storms have wind speeds above 24-28 m/s, destructive storms — above 28-33 m/s, and hurricanes — above 33 m/s. On the color scale it is lilac to purple. If you are more used to the Beaufort wind force scale, storms and destructive storms are values 10 and 11, and hurricanes are 12, the maximum.
Given that the hurricane map in the app is interactive, you can also figure this out by wind swirls. For example, here’s what it looks like in the North Atlantic Ocean between the US and the UK at the time of this writing.

Hurricane Map in the Windy.app for iOS
4. As we said before, in addition to strong winds with gusts, hurricanes also bring heavy precipitation with them, so you can also determine their location by this weather element. To do this, select the Precipitation layer on the map. You can easily check this connectivity by changing the layer back to the wind and then back to precipitation. Look at the screenshots above and below from this paragraph. Can you see how these areas correspond to each other?

Hurricane Map in the Windy.app for iOS
For Precipitation layer, there is also a color scale at the top of the screen whose colors more or less coincide with the wind scale, only instead of speed (m/s) on it you will find the precipitation size in mm. Heavy precipitation is considered to be already more than 1 mm per hour, and very heavy and destructive — from 10 mm and more, which corresponds to the colors from dark blue through green to dark orange. Accordingly, light precipitation is less than 1 mm (light blue color).
Learn more about how do we measure precipitation and what does a chance of rain, say 30%, actually mean.
5. To find out the exact predicted wind speed and gust at a particular location, click on an outdoor spot or any point on the map you want. In response to your simple effort, a widget will appear with wind speed or gust, and wind direction. Plus the coordinates of that location.

Hurricane Map in the Windy.app for iOS

Hurricane Map in the Windy.app for iOS
6. From the hurricane map, go to the Spot screen to get for it a detailed weather forecast of more than three dozen elements from more than 10 weather models — forecast sources. For the whole world, we recommend using ECMWF as the most accurate in general, for the USA — NAM and HRRR regional models, for Europe — ICON7 model, and for Asia — the Windy.app’s WRF8.

Spot screen in the Windy.app for iOS
The same is available for precipitation.
Select Accumulated Precipitation to find out this forecasted parameter for the next 12 and 24 hours, 3, 5 and 10 days.

Accumulated Precipitation Map in the Windy.app for iOS
7. To get accurate real-time wind data, activate the Live Weather Stations function and click on one of them. Many stations are located on islands and can be very close to hurricanes.

Live Weather Stations Map in the Windy.app for iOS

Weather station screen in the Windy.app for iOS
8. By the way, a selection of weather models is also available for the Weather Map. Here you will see almost all of the same models.

Weather models on the Weather Map in the Windy.app for iOS
9. To see the average wind speed data for each month in any of the years 2012 through 2022, click on the Wind Archive layer. To get accurate historical wind and precipitation data for each day for the past 10 years, go to Weather History.

Wind Archive Map in the Windy.app for iOS

Weather History in the Windy.app for iOS

Weather History in the Windy.app for iOS
10. Finally, you can also find a hurricane map on the Windy.app site, where accurate wind and precipitation data for spots and just a points on the map is also available, as well as the Weather Stations and Weather History sections. On the Windy.app site, the wind map is a separate map in the appropriate section you can find on the following URL: https://windy.app/map.
If any of the above remains unclear to you, read the separate, more detailed guides to the wind map in the app and on the website.
Text: Ivan Kuznetsov
Cover photo: John O Nolan / Unsplash
You will also find useful
The collection of articles about wind forecasting
Latest News
Professional Weather App
Get a detailed online 10 day weather forecast, live worldwide wind map and local weather reports from the most accurate weather models.
Compare spot conditions, ask locals in the app chat, discover meteo lessons, and share your experience in our Windy.app Community.
Be sure with Windy.app.


